


 21 December 2017
2017- n° 338In December 2017, the business climate in services improves again Monthly survey of services - December 2017
21 December 2017
2017- n° 338In December 2017, the business climate in services improves again Monthly survey of services - December 2017
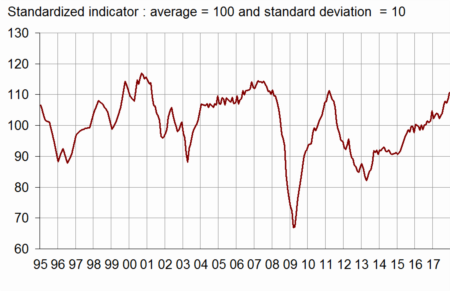
According to business managers surveyed in December 2017, the business climate in services has improved again. The business climate composite indicator has gained two points and reached 111, its highest level since April 2011.
- Balances of activity and demand on the rise
- In road transport, the business climate continues to improve
- In accommodation and food services, the business climate has improved sharply
- The business climate is steady in information and communication
- In real estate activities, the business climate has improved
- Steady business climate in professional activities
- The business climate has risen again in administrative and support service activities
According to business managers surveyed in December 2017, the business climate in services has improved again. The business climate composite indicator has gained two points and reached 111, its highest level since April 2011.
graphiqueGraph 1 – Business climate composite indicator
The turning point indicator remains in the area indicating a favourable short-term economic situation.
graphiqueGraph 2 – Turning point indicator
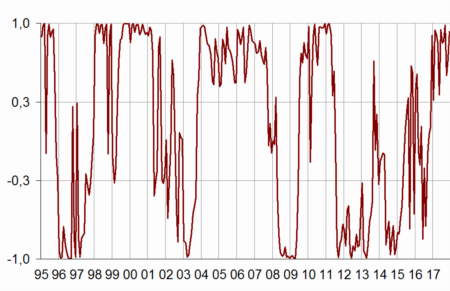
- Note: close to 1 (respectively -1), this indicator indicates a favourable short-term economic situation (respectively unfavourable). The uncertainty area is between -0.3 and +0.3.
Balances of activity and demand on the rise
The balances of opinion on past activity, on expected activity and on expected demand have increased in December. The balance on past activity is at its highest level since April 2008, the one on expected activity since February 2008 and the one on expected demand since April 2011. The balance on general outlook, which relates the assessment of business leaders over their whole sector, has gone up again slightly.
In contrast to the balances of opinion on activity, those on selling prices and investments have decreased this month.
After a moderate decline last month, the balance on expected employment has increased sharply due to temporary work agencies and remains clearly above its long-term average. The one on past employment is virtually stable with, however, a decline in services except temporary work agencies.
tableauTable 1 – Economic outlook in the services sector
| Average* | Sept. 17 | Oct. 17 | Nov. 17 | Dec. 17 | |
|---|---|---|---|---|---|
| Composite indicator | 100 | 108 | 107 | 109 | 111 |
| General outlook | –8 | 3 | 2 | 3 | 4 |
| Past activity | 2 | 9 | 9 | 12 | 15 |
| Expected activity | 2 | 8 | 8 | 8 | 11 |
| Expected demand | –1 | 6 | 5 | 7 | 9 |
| Past selling prices | –4 | –4 | –5 | 0 | –1 |
| Expected selling prices | –3 | –1 | –3 | –2 | –4 |
| Past employment | 3 | 8 | 10 | 12 | 13 |
| except temporary work agencies | 1 | 2 | 4 | 6 | 4 |
| Expected employment | 2 | 8 | 7 | 5 | 11 |
| except temporary work agencies | –1 | 4 | 5 | 2 | 2 |
| Investments | |||||
| Past investments | 2 | 4 | 6 | 6 | 2 |
| Expected investments | 1 | 6 | 4 | 7 | 0 |
- * Average since 1989 for the composite indicator and since 1988 for the balances of opinion
- Source: INSEE, monthly business survey in services.
In almost all the service sub-sectors, the business climate indicator is very high. In particular, it has improved markedly in accommodation and food service activities. In real estate activities, the climate remains clearly below its long-term average despite a small rebound this month.
In road transport, the business climate continues to improve
In road transport, the climate indicator has advanced for the fifth month in a row (116). The balances on past activity, on expected demand, on past and expected employment have climbed. This increase is partly offset by a decrease in the balances on expected activity and on general outlook. All balances remain well above their average.
In accommodation and food services, the business climate has improved sharply
In accommodation and food services, the business climate has gained four points and reached 111, its highest level since October 2011. This rise is mainly due to the strong growth in the balances on past activity and on expected demand. However, the balance on past employment has declined sharply.
The business climate is steady in information and communication
In information and communication, the business climate is stable, clearly above its long-term average. The balance on expected activity has gone up significantly and remains at its highest level since July 2011. In contrast, the balance on past activity has dipped while remaining well above its average.
In real estate activities, the business climate has improved
After a fall in the two last months due to the sector of housing rental, the business climate has recovered a little in real estate activities and has gained two points. The balances on expected demand, on past employment and on general outlook have picked up whereas the balances on activity and on expected employment have decreased.
Steady business climate in professional activities
The business climate in professional, scientific and technical activities remains at 110, well above its long-term average. The sharp increase in balances on past activity and on employment is offset by the decline in the balances on expected activity and on expected demand.
The business climate has risen again in administrative and support service activities
In administrative and support service activities, the business climate indicator has increased for the fifth month in a row. At 112, it stands at its highest level since July 2007. All the balances of opinion are markedly above their long-term average and have increased this month, except the one on past employment.
tableauTable 2 – Business climate composite indicator and balances of opinion by sub-sector in services
| Aggregated classification (NA 2008) at level A21 | Mean* | Sept. 17 | Oct. 17 | Nov. 17 | Dec. 17 |
|---|---|---|---|---|---|
| Road transport (8%) | |||||
| Composite indicator | 100 | 110 | 113 | 115 | 116 |
| Past activity | –7 | 7 | 7 | 9 | 14 |
| Expected activity | –8 | 6 | 8 | 14 | 12 |
| Expected demand | –11 | 4 | 14 | 15 | 18 |
| Past employment | –6 | 5 | 9 | 15 | 18 |
| Expected employment | –9 | 6 | 14 | 4 | 10 |
| General outlook | –21 | 1 | 3 | 9 | 7 |
| Accommodation and food service activities (11%) | |||||
| Composite indicator | 100 | 110 | 106 | 107 | 111 |
| Past activity | –7 | 1 | –3 | 0 | 10 |
| Expected activity | –7 | –1 | –4 | –1 | 1 |
| Expected demand | –10 | 4 | –4 | –6 | 0 |
| Past employment | –4 | –5 | –5 | 3 | –6 |
| Expected employment | –6 | –9 | –6 | –6 | –5 |
| General outlook | –14 | –2 | –4 | –3 | 0 |
| Information and communication (24%) | |||||
| Composite indicator | 100 | 105 | 104 | 107 | 107 |
| Past activity | 8 | 18 | 20 | 27 | 22 |
| Expected activity | 9 | 15 | 13 | 17 | 23 |
| Expected demand | 10 | 8 | 6 | 10 | 12 |
| Past employment | 6 | 5 | 10 | 12 | 14 |
| Expected employment | 11 | 20 | 16 | 15 | 14 |
| General outlook | 0 | 3 | 3 | 7 | 8 |
| Real estate activities (13%) | |||||
| Composite indicator | 100 | 105 | 99 | 88 | 90 |
| Past activity | 7 | 11 | 9 | 15 | 10 |
| Expected activity | 7 | 13 | 6 | –8 | –9 |
| Expected demand | 1 | 4 | 7 | 0 | 4 |
| Past employment | 3 | –3 | 5 | –3 | 6 |
| Expected employment | 3 | 6 | 7 | 8 | 4 |
| General outlook | –2 | 5 | –12 | –17 | –14 |
| Professional, scientific and technical activities (24%) | |||||
| Composite indicator | 100 | 108 | 109 | 110 | 110 |
| Past activity | –1 | 5 | 1 | 2 | 9 |
| Expected activity | –2 | 3 | 6 | 7 | 6 |
| Expected demand | –5 | 3 | 1 | 5 | 3 |
| Past employment | 1 | 2 | 3 | 7 | 10 |
| Expected employment | 0 | 11 | 12 | 9 | 12 |
| General outlook | –9 | 0 | 2 | 3 | 3 |
| Administrative and support service activities (18%) | |||||
| Composite indicator | 100 | 107 | 109 | 110 | 112 |
| Past activity | 6 | 11 | 9 | 11 | 16 |
| Expected activity | 5 | 8 | 15 | 12 | 14 |
| Expected demand | 3 | 10 | 12 | 16 | 17 |
| Past employment | 10 | 19 | 20 | 25 | 25 |
| Expected employment | 8 | 14 | 6 | 8 | 22 |
| General outlook | –4 | 9 | 11 | 12 | 13 |
- The figures in parentheses indicate the weights used to aggregate the sub-sector balances of opinion.
- *Composite indicator: average since 1989 (2006 for road transport); balances of opinion : average since 1988 (2006 for road transport)
- Source : INSEE, monthly business survey in services.
Documentation
Abbreviated Methodology (2017) (pdf,177 Ko)
Pour en savoir plus
Time series : Economic outlook surveys – Services
