


 30 November 2017
2017- n° 317In Q3 2017, producer prices for services sold to French businesses decreased by 0.2% Services producer price indices - third quarter 2017
30 November 2017
2017- n° 317In Q3 2017, producer prices for services sold to French businesses decreased by 0.2% Services producer price indices - third quarter 2017
In the third quarter of 2017, producer prices of services sold to French businesses dipped slightly (−0.2% after +0.5%). Year over year, they grew by 0.5%, as in the previous quarter.
- SPPI, production sold to French businesses
- Seasonal declines in prices for most services in the third quarter
- Virtual stability in prices for real estate activities
- Rise in prices for transport and storage services
- SPPI, production sold to households in France
- SPPI, production sold on foreign markets
- SPPI (all markets)
SPPI, production sold to French businesses
In the third quarter of 2017, producer prices of services sold to French businesses dipped slightly (−0.2% after +0.5%). Year over year, they grew by 0.5%, as in the previous quarter.
Seasonal declines in prices for most services in the third quarter
Prices for information-communication services fell back in the third quarter of 2017 (−0.6% after +0.4%), due to the seasonal decline in prices for television programming and broadcasting services (−9.8%).
Prices for accomodation-food services dwindled (−1.2% after +1.5%), due to the seasonal decline in prices for hotels and similar accommodation services, aimed to professionals.
Prices for scientific and technical services went down by 0.3% (after −0.1%). The sharp fall in prices for media representation (−8.2%) was eased by the rise in prices for business and other management consulting services.
Prices for admistrative and support services declined slightly (−0.2% after +0.8%), in the wake of the decline of temporary employment agency services (−1.6% after +2.0%).
Virtual stability in prices for real estate activities
Prices for real estate activities held steady after their significant increase the previous quarter (+0.1% after +0.9%) and slowed down year over year (+0.8% after +2.7%).
Rise in prices for transport and storage services
Prices for transport and storage services remained buoyant (+0.5% as in the previous quarter and +1.2% year over year) thanks to the seasonal rise in prices for passenger air transport.
SPPI, production sold to households in France
In the third quarter of 2017, producer prices of services sold to households in France sped up sharply (+1.6% after +0.3%). This rise, widely seasonal, came essentially from accomodation-food services, transport and storage services and, to a lesser extent, real estate activities. Prices for other services were on slight decrease or stable.
SPPI, production sold on foreign markets
After their rise in the previous quarter (+0.5%), export prices were virtually stable in the third quarter (−0.1%). The fall in prices for admistrative and support services (−1.8%) was offset by the rise in prices for transport and storage services (+1.7%).
SPPI (all markets)
In the third quarter of 2017, on all markets, producer prices of services slowed down slightly (+0.3% after +0.5%). Year over year, they rose by 0.7% (after +0.8%).
graphiqueGraphique1 – Producer price indices for all services
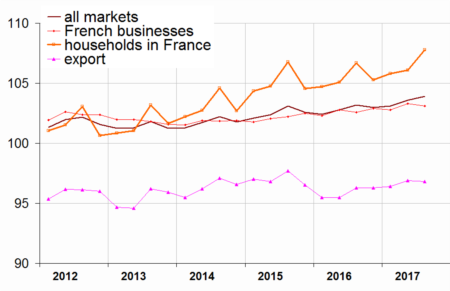
- Source: INSEE
graphiqueGraphique2 – Producer price indices of services sold to French businesses
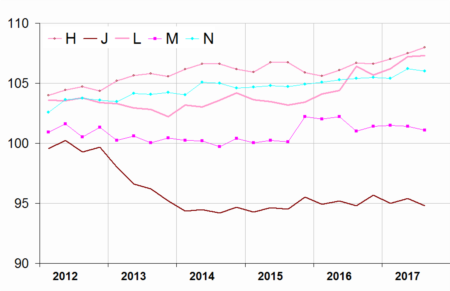
- Source: INSEE
graphiqueGraphique3 – Services producer price indices, all markets
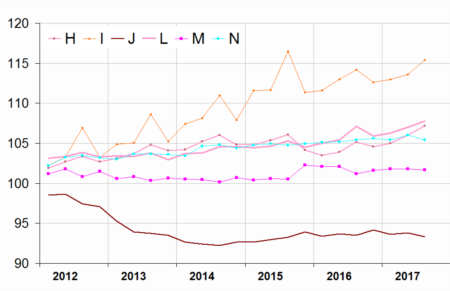
- Source: INSEE
tableauTableau1 – Services producer price indices, by sector:
| Sections and choices of | Weight | Indices | Change in % | |
|---|---|---|---|---|
| levels in NAF rev.2 | 2017Q03 | Q/Q-1 | Q/Q-4 | |
| Prices of services sold to French businesses (BtoB) | ||||
| HN : all services | 1000 | 103.1 | –0.2 | 0.5 |
| H : transport. and storage | 180 | 108.0 | 0.5 | 1.2 |
| 49 : land and pipeline transport | 81 | 106.4 | 0.2 | 1.0 |
| 52 : warehousing and auxiliary services for transport | 73 | 107.3 | –0.2 | 0.8 |
| I : accommodation and food | 44 | 111.0 | –1.2 | 0.1 |
| J : information and communic. | 237 | 94.8 | –0.6 | 0.0 |
| 62 : IT services | 92 | 101.7 | –0.4 | –0.5 |
| L : real estate activities | 103 | 107.3 | 0.1 | 0.8 |
| M : prof., scient. and tech. | 218 | 101.1 | –0.3 | 0.1 |
| 69 : Legal and accounting services | 46 | 103.6 | –0.3 | –0.3 |
| 70 : activities of head offices and management consulting services | 47 | 104.2 | 1.0 | 0.4 |
| 71 : Architectural and engineering services | 83 | 100.1 | 0.1 | 0.0 |
| 73 : Advertising and market research services | 26 | 96.7 | –2.5 | 1.3 |
| N : administ. and support serv. | 210 | 106.0 | –0.2 | 0.6 |
| 77 : renting & leasing services | 60 | 98.7 | 0.0 | –0.5 |
| 78 : employment services | 52 | 108.7 | –1.4 | 0.8 |
| 82 : Office administrative and support services | 46 | 109.1 | –0.9 | 1.3 |
| Prices of services sold to households in France (BtoC) | ||||
| HN : all services | 1000 | 107.8 | 1.6 | 1.0 |
| H : transport. and storage | 153 | 113.4 | 3.1 | 2.8 |
| I : accommodation and food | 255 | 117.6 | 2.9 | 1.6 |
| J : information and communic. | 179 | 90.6 | –0.3 | –0.5 |
| L : real estate activities | 284 | 108.3 | 1.3 | 0.5 |
| M : prof., scient. and tech. | 73 | 104.6 | 0.0 | 1.9 |
| N : administ. and support serv. | 42 | 96.8 | –0.2 | –1.7 |
| Export prices of services (BtoE) | ||||
| HN : all services | 1000 | 96.8 | –0.1 | 0.5 |
| H : transport. and storage | 313 | 95.6 | 1.7 | 3.1 |
| J : information and communic. | 148 | 80.2 | –0.4 | –1.0 |
| M : prof., scient. and tech. | 215 | 101.8 | 0.5 | 0.9 |
| N : administ. and support serv. | 314 | 103.6 | –1.8 | –1.3 |
| Prices of services sold on all markets (BtoAll) | ||||
| HN : all services | 1000 | 103.9 | 0.3 | 0.7 |
| H : transport. and storage | 189 | 107.2 | 1.1 | 1.9 |
| I : accommodation and food | 92 | 115.4 | 1.6 | 1.1 |
| J : information and communic. | 212 | 93.3 | –0.5 | –0.2 |
| L : real estate activities | 136 | 107.8 | 0.7 | 0.7 |
| M : scient. and tech. services | 181 | 101.7 | –0.1 | 0.5 |
| N : administ. and support serv. | 180 | 105.4 | –0.6 | 0.0 |
- s: statistical confidentiality
- BtoB: business to business
- BtoC: business to consumer
- BtoE: business to exports
- BtoAll: business to all
- Source: INSEE
tableauTableau3 – Revision of variations
| Services producer price indices | 2017T02 / 2017T01 |
|---|---|
| - services sold to all markets | // |
| - services sold to French businesses | // |
| - services sold to consumers in France | -0.2 |
| - export of services | 0.1 |
- //: unchanged compared to the previous release
- How to read it : there was no change in the variation of the services price index for services sold to French businesses between the first quarter and the second quarter 2017. Published at the end of August 2017at +0.5%, it has not been revised.
- Source: INSEE
Documentation
Simplified methodology (pdf,134 Ko)
Pour en savoir plus
Time series : Services producer price indices
