


 15 November 2017
2017- n° 299Rise in business start-ups in October 2017 Enterprise births - October 2017
15 November 2017
2017- n° 299Rise in business start-ups in October 2017 Enterprise births - October 2017
In October 2017, the number of business births for all entreprises rose (+2.6%, seasonally and working-day adjusted), following a near-stability in September. Start-ups excluding self-managed micro-entrepreneurs speeded up (+4.2% after +0.6%) and micro-entrepreneurs' registrations slightly rebounded (+0.3% after −0.3%).
In October 2017, the number of business births for all entreprises rose (+2.6%, seasonally and working-day adjusted), following a near-stability in September. Start-ups excluding self-managed micro-entrepreneurs speeded up (+4.2% after +0.6%) and micro-entrepreneurs' registrations slightly rebounded (+0.3% after −0.3%).
graphiqueGraph1 – Business start-ups (SA-WDA *)
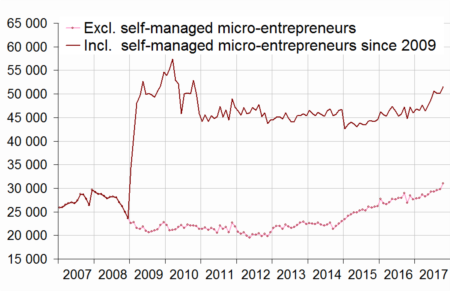
- * Seasonally and working-day adjusted data
- Source: INSEE (Sirene)
tableauTable1 – Business set-ups by month (SA-WDA *)
| July 2017 | Aug. 2017 | Sept. 2017 | Oct. 2017 | |
|---|---|---|---|---|
| Excl. self-managed micro-entrepreneurs | 29,301 | 29,588 | 29,775 | 31,012 |
| Variation [m-o-m] % | 0.3 | 1.0 | 0.6 | 4.2 |
| Incl. self-managed micro-entrepreneurs | 50,677 | 50,127 | 50,249 | 51,547 |
| Variation [m-o-m] % | 3.7 | -1.1 | 0.2 | 2.6 |
- * Seasonally and working-day adjusted data
- Source: INSEE (Sirene)
+10.6% year on year (three months basis)
Compared to the same period one year before, the raw amount of births added up in the last three months went up strongly (+10.6% in raw data). Micro-entrepreneurs' registrations increased sharply (+13.8%) as well as sole proprietorship start-ups excluding micro-entrepreneurs (+9.9%). It was also the case for company births but at a slower pace (+6.8%). Business support activities and trade were the sectors that contributed the most to the overall rise1.
tableauTable2 – Cumulated business start-ups by type
| Moving total % change * | Moving total | Moving total | ||
|---|---|---|---|---|
| over 3 months | over 12 months | January- October 2017 | January- October 2016 | |
| Total | 10.6 | 5.3 | 489,069 | 464,452 |
| Companies | 6.8 | 5.8 | 164,667 | 156,111 |
| Sole proprietorships (SP) | 12.3 | 5.0 | 324,402 | 308,341 |
| SP excluding self-managed micro-entrepreneurs | 9.9 | 4.8 | 126,201 | 120,560 |
| Self-managed micro-entrepreneurs | 13.8 | 5.2 | 198,201 | 187,781 |
- * Total of business start-ups during the last 3 or 12 months compared with the same months a year earlier
- Source: INSEE (Sirene)
+5.3% over the last twelve months
The raw number of business start-ups totted up during the last twelve months kept growing (+5.3% after +3.2%). All the types of business start-ups expanded : company births by +5.8%, micro-entrepreneurs' registrations by +5.2% and sole proprietorship start-ups excluding self-managed micro-entrepreneurs by +4.8%.
Two business set-ups out of five are self-managed micro-entrepreneurs' registrations
In October 2017, the share of micro–entrepreneurs' registrations in the businesses set up over the last twelve months was steady at 40.3%.
tableauTable0 – Business set-ups distribution by type
| Aug. 2017 | Sept. 2017 | Oct. 2017 | |
|---|---|---|---|
| Companies | 34.4 | 34.3 | 34.1 |
| Sole proprietorships excluding self-managed micro-entrepreneurs | 25.5 | 25.4 | 25.6 |
| Self-managed micro-entrepreneurs | 40.1 | 40.3 | 40.3 |
- Source: INSEE (Sirene)

1 The contribution of a sector to the overall variation is the variation observed in this sector, weighted by the share of this sector in the total number of births.
Business set-ups by economic activity
graphiqueGraph2 – Trade and business support activities start-ups (SA-WDA *)
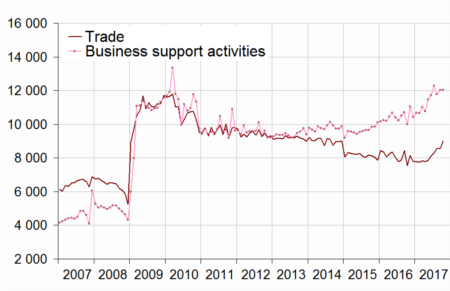
- * Seasonally and working-day adjusted data
- Source: INSEE (Sirene)
graphiqueGraph3 – Construction and transportation business set-ups (SA-WDA *)
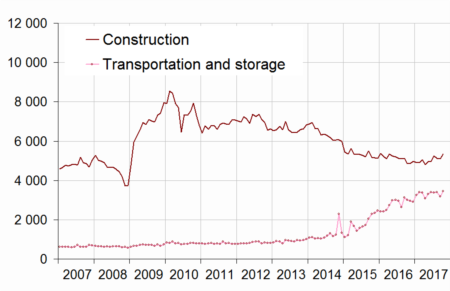
- * Seasonally and working-day adjusted data
- Source: INSEE (Sirene)
tableauTable3 – Number of business set-ups (incl. self-managed micro-entrepreneurs)
| NA | Aug. 2017 | Sept. 2017 | Oct. 2017 | |
|---|---|---|---|---|
| Total | 50,127 | 50,249 | 51,547 | |
| Industry | BE | 2,137 | 2,192 | 2,225 |
| Of which Manufacturing | C | 1,883 | 1,948 | 1,954 |
| Construction | FZ | 5,127 | 5,094 | 5,353 |
| Wholesale and retail trade, Transport, Accommodation and Food and beverage activities | GI | 14,534 | 14,362 | 15,069 |
| Trade | G | 8,566 | 8,567 | 9,004 |
| Transportation and storage | H | 3,410 | 3,168 | 3,457 |
| Accommodation and food service activities | I | 2,557 | 2,628 | 2,609 |
| Information and communication | JZ | 2,510 | 2,595 | 2,544 |
| Financial and insurance activities | KZ | 1,376 | 1,447 | 1,408 |
| Real estate activities | LZ | 1,959 | 1,984 | 2,030 |
| Business support activities | MN | 11,774 | 12,026 | 12,034 |
| Public administration and defence, education, human health and social work activities | OQ | 6,198 | 6,040 | 6,181 |
| Other services activities | RS | 4,513 | 4,509 | 4,704 |
- * Seasonally and working-day adjusted data
- Source: INSEE (Sirene)
tableauTable4 – Fluctuation in the number of business set-ups (incl. self-managed micro-entrepreneurs)
| NA | Oct. 17 / Sept. 17 | Moving total % change** | ||
|---|---|---|---|---|
| SA-WDA * | over 3 months | over 12 months | ||
| Total | 2.6 | 10.6 | 5.3 | |
| Industry | BE | 1.5 | 9.0 | 2.2 |
| Of which Manufacturing | C | 0.3 | 11.3 | 1.2 |
| Construction | FZ | 5.1 | 3.9 | -3.0 |
| Wholesale and retail trade, Transport, Accommodation and Food and beverage activities | GI | 4.9 | 9.2 | 4.7 |
| Trade | G | 5.1 | 10.4 | 0.1 |
| Transportation and storage | H | 9.1 | 13.2 | 20.2 |
| Accommodation and food service activities | I | -0.7 | 0.3 | 2.8 |
| Information and communication | JZ | -2.0 | 12.1 | 6.3 |
| Financial and insurance activities | KZ | -2.7 | 6.5 | 3.5 |
| Real estate activities | LZ | 2.3 | 26.0 | 15.0 |
| Business support activities | MN | 0.1 | 16.0 | 10.0 |
| Public administration and defence, education, human health and social work activities | OQ | 2.3 | 5.1 | 5.2 |
| Other services activities | RS | 4.3 | 14.1 | 4.2 |
- * Seasonally and working-day adjusted data
- ** Total of business start-ups during the last 3 or 12 months compared with the same months a year earlier
- Source: INSEE (Sirene)
Pour en savoir plus
Time series : Business demography
