


 7 November 2017
2017- n° 294In the manufacturing industry, business managers expect their investment to remain
stable in 2018 after a 4% rise in 2017 Industrial investment survey - October 2017
7 November 2017
2017- n° 294In the manufacturing industry, business managers expect their investment to remain
stable in 2018 after a 4% rise in 2017 Industrial investment survey - October 2017
The business managers surveyed in October 2017 forecast that investment in the manufacturing industry will expand by 4% in 2017 in nominal terms. For 2018, they forecast stability in their investment spending compared to 2017.
- Investment spending in the sector of electrical and electronic equipment and machinery is set to rise sharply in 2017
- For 2018, investment is expected to be steady in the manufacturing industry
- For H1 2018, more business leaders plan an increase in their investment than a decrease
- The financing terms are considered more stimulating than on average
- In 2018, the purposes of investment spending are similar to those in 2017
The business managers surveyed in October 2017 forecast that investment in the manufacturing industry will expand by 4% in 2017 in nominal terms. For 2018, they forecast stability in their investment spending compared to 2017.
Investment spending in the sector of electrical and electronic equipment and machinery is set to rise sharply in 2017
With an expected overall increase of 4% in investment for 2017, business managers have lowered their July 2017 estimate by 3 points. This downward revision is in line with the average recorded at this time of the year since 2005.
In the sector of electrical and electronic equipment and machinery, investment spending should rise at a slower pace than announced in July while remaining very high. Similarly, business managers in the “other manufacturing” sector have lowered the anticipated increase in their investment for 2017. Expectations in the other sectors have changed little compared to the July survey.
graphiqueGraph 1 – Annual nominal change in investment in the manufacturing industry
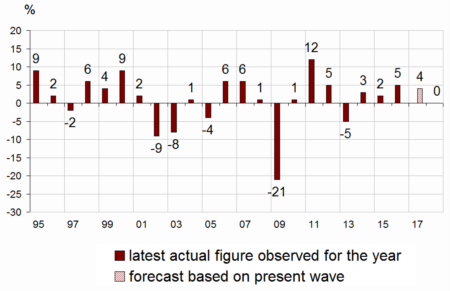
- Source: INSEE - Industrial investment survey
For 2018, investment is expected to be steady in the manufacturing industry
On average over 2018, business leaders expect a stability in their investment expenditures compared to 2017. Investment should slow down in the sector of electrical and electronic equipment and machinery but should remain dynamic. Investment should decline again in the sector of transport equipment, more sharply than the previous year. It should fall back in the agrifood industry.
tableauTable 1 – Real annual investment growth in the manufacturing industry by main sector
| NA*: (A17) et [A38] | In 2017 | In 2018 | |
|---|---|---|---|
| forecast Jul.17 | forecast Oct.17 | forecast Oct.17 | |
| C: MANUFACTURING INDUSTRY | 7 | 4 | 0 |
| (C1): Manufacture of food products and beverages | 7 | 8 | –5 |
| (C3): Manufacture of electrical and electronic equipment; Manufacture of machinery | 25 | 21 | 10 |
| (C4): Manufacture of transport equipment | –7 | –8 | –11 |
| [CL1]: Motor vehicles | –11 | –11 | –9 |
| (C5): Other manufacturing | 7 | 2 | 2 |
| Total sectors (C3-C4-C5) | 7 | 3 | 1 |
- How to read this table: in the manufacturing industry, firms surveyed in October 2017 forecast a nominal investment increase of 4% in 2017 compared with 2016 and a stability in 2018 compared with 2017.
- * The codes correspond to the level of aggregation (A17) and [A38] of the "NA" aggregate classification based on NAF rev.2
- Source: INSEE - Industrial investment survey
The estimate for 2018 could be revised over the next quarters: on average since 2004, the October estimate has been 3 points lower than the next estimate issued in January of the following year.
For H1 2018, more business leaders plan an increase in their investment than a decrease
In October 2017, far more business managers in industry reported a rise rather than a drop in their investment for H2 2017. The corresponding balance (+17) is slightly up, above its long-term average. For H1 2018, business leaders have been also more numerous to anticipate a rise than a drop in their investment. The corresponding balance (+11) is steady, above its long-term average (+6).
graphiqueGraph 2 – Six-month change in investment (first estimation)
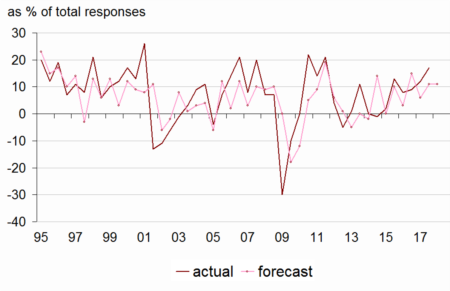
- Source: INSEE - Industrial investment survey
The financing terms are considered more stimulating than on average
For 2017 and 2018, the financing terms (cash flow, indebtedness, interest rates, overall financing conditions) have been still considered to be stimulating. The related balances of opinion are markedly above their long-term average, especially those on interest rates and financing conditions. The balances on domestic and foreign demand outlook have remained also at a high level, above their long-term average. For 2018, the foreign-demand outlook has been judged more stimulating than in 2017.
tableauTable 2 – Factors influencing investment decisions
| Average | in 2017 | in 2018 | |
|---|---|---|---|
| 1991-2017 | (actual) | (forecast) | |
| Domestic-demand outlook | 49 | 56 | 56 |
| Foreign-demand outlook | 53 | 59 | 63 |
| Expected profits from new investment | 82 | 76 | 76 |
| Cash flow | 16 | 20 | 22 |
| Indebtedness | –2 | 8 | 9 |
| Interest rates | 9 | 32 | 32 |
| Overall financing conditions | 14 | 33 | 33 |
| Technical factors (1) | 63 | 61 | 60 |
| Other factors (such as tax incentives) | 23 | 31 | 31 |
- (1) Technological developments and need for labor to adjust to these new technologies
- For each factor, the balance of opinion is calculated as the difference between the percentage of stimulating answers and the percentage of limiting answers.
- Source: INSEE - Industrial investment survey
In 2018, the purposes of investment spending are similar to those in 2017
In 2018, the purposes of investment are set to be similar to those of 2017. The share of investment meant for the replacement of equipment should remain slightly above its long-term average. Nonetheless, the share of investment meant for modernization and streamlining should slightly decrease below its long-term average.
tableauTable 3 – Share of purposes of investment
| Average | 2017 | 2018 | |
|---|---|---|---|
| 1991-2017 | actual | forecast | |
| Replacement | 27 | 29 | 29 |
| Modernization, streamlining | 24 | 24 | 22 |
| Automation | 11 | 8 | 8 |
| New production methods | 7 | 8 | 7 |
| Energy savings | 6 | 8 | 7 |
| Increase in productive capacity | 16 | 15 | 16 |
| Introduction of new products | 14 | 13 | 12 |
| Other purposes (safety, environment, working conditions…) | 20 | 20 | 21 |
- Source: INSEE - Industrial investment survey
Documentation
Methodology 2017 (pdf,147 Ko)
Pour en savoir plus
Time series : Industry – Investment
