


 24 October 2017
2017- n° 275In October 2017, the business climate in manufacturing stabilises at its highest level
since December 2007 Monthly business survey (goods-producing industries) - October 2017
24 October 2017
2017- n° 275In October 2017, the business climate in manufacturing stabilises at its highest level
since December 2007 Monthly business survey (goods-producing industries) - October 2017
According to the business managers surveyed in October 2017, the business climate in industry remains stable. At 111, it stands at its highest level since December 2007.
- Manufacturers are very upbeat about general production prospects, somewhat less about their own perspectives
- Revisions
- In the food and beverage production industry, the business climate has picked up
- The business climate has further improved in the manufacture of machinery and equipment goods
- The business climate remains stable in the transport equipment manufacture
- The business climate in “other manufacturing industries” reached a level unseen since the end of 2007
According to the business managers surveyed in October 2017, the business climate in industry remains stable. At 111, it stands at its highest level since December 2007.
graphiqueGraph 1 – Business climate in industry - Composite indicator

The turning-point indicator remains in the zone indicating a further favourable economic outlook.
graphiqueGraph 2 – Turning-point indicator
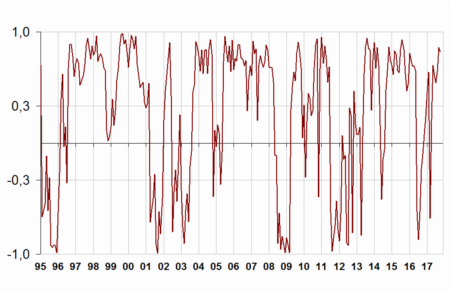
- How to read it: close to 1, the indicator points to a favourable short-term economic situation (-1 is unfavourable). The uncertainty area is between −0.3 and +0.3.
Manufacturers are very upbeat about general production prospects, somewhat less about their own perspectives
The balance of opinion on past activity, already significantly above its average in September, is back on track. The one about their personal production expectations has dipped but remains well above its long-run average.
Manufacturers are increasingly optimistic about general production prospects for the sector. The corresponding balance has continued to rise and reached its highest level since October 2000.
The balances on overall and export order books are virtually stable in October, standing at their highest point since March 2008.
Lastly, more industrialists than in September consider that their finished-goods inventories are above normal: the corresponding balance nevertheless remains well below its long-term mean.
tableauTable 1 – Industrialists' opinion on manufacturing activity
| Manufacturing industry | Ave.* | July 17 | Aug. 17 | Sept. 17 | Oct. 17 |
|---|---|---|---|---|---|
| Composite indicator | 100 | 108 | 111 | 111 | 111 |
| Past activity | 5 | 9 | 21 | 12 | 16 |
| Finished-goods inventory | 13 | 5 | 4 | 3 | 6 |
| Overall order books | –18 | –3 | –3 | 0 | 0 |
| Export order books | –14 | –1 | 0 | 1 | 2 |
| Personal production expectations | 5 | 11 | 14 | 20 | 17 |
| General production expectations | –8 | 21 | 20 | 23 | 31 |
- * Long-term average since 1976.
- Source: INSEE - Monthly business tendency survey in industry
Revisions
The business climate in manufacturing in September 2017 has been slightly raised since its first estimation last month, from 110 to 111, mainly due to the inclusion of late responses from businesses.
In the food and beverage production industry, the business climate has picked up
The business climate in the manufacture of food products and beverages has increased by four points in October, after a decline in the previous month. At 111 it is well above its long-term average. This upturn mainly comes from a sharp rise in the balance of opinion on past activity, and to a lesser extent, on global order books.
The business climate has further improved in the manufacture of machinery and equipment goods
In the overall manufacture of machinery and equipment goods, the business climate has continued to expand significantly above its mean. This improvement is mainly due to a rebound in the balance on export orders.
The business climate has improved in electrical equipment and in machinery and equipment. It remains steady in the computer, electronic and optical product industry.
The business climate remains stable in the transport equipment manufacture
In the transport equipment manufacture, the business climate holds steady at 109 for the fourth month in a row, well above its long-term average. The decrease in the balances of opinion on order books has been offset by the rise in that on past activity, due to motor vehicles.
The business climate has improved in the manufacture of motor vehicles, trailers and semi-trailers while it has inched down in other transport equipment.
The business climate in “other manufacturing industries” reached a level unseen since the end of 2007
In overall “other manufacturing”, the business climate has improved and reached its highest level since the end of 2007. This expansion has been driven by an increase in the balance of opinion on past activity and on global and export order books.
In particular, the business climate indicator has brightened in “other manufacturing industries”, basic metals and clothing-textiles. It is stable in rubber and plastic products and virtually stable in chemicals. In contrast it has edged down in wood-paper, returning to its August level.
graphiqueGraph 3 – Business climates in a sector-based approach

- Legend: (C1): Manufacture of food products and beverages - (C3): Machinery and equipment goods - (C4): Manufacture of transport equipment - (C5): Other manufacturing
tableauTable 2 – Business climates in a sector-based approach
| NA* : (A17) et [A38 et A64] | Weights** (%) | Aug. 17 | Sept. 17 | Oct. 17 |
|---|---|---|---|---|
| (C1) Man. of food products and beverages | 22 | 110 | 107 | 111 |
| (C3) Machinery and equipment goods | 11 | 107 | 108 | 110 |
| [CI] Computer, electronic and optical products | 3 | 112 | 112 | 112 |
| [CJ] Electrical equipment | 3 | 108 | 103 | 107 |
| [CK] Machinery and equipment | 5 | 103 | 106 | 109 |
| (C4) Man. of transport equipment | 15 | 109 | 109 | 109 |
| [CL1] Motor vehicles, trailers and semi-trailers | 7 | 111 | 111 | 112 |
| [CL2] Other transport equipment | 8 | 104 | 105 | 104 |
| (C5) Other manufacturing | 46 | 108 | 109 | 111 |
| [CB] Textiles, clothing industries, leather and footwear industry | 2 | 103 | 105 | 107 |
| [CC] Wood, paper, printing | 5 | 111 | 113 | 111 |
| [CE] Chemicals and chemical products | 9 | 109 | 109 | 108 |
| [CG] Rubber and plastic products | 7 | 112 | 114 | 114 |
| [CH] Basic metals and fabricated metal products | 11 | 105 | 106 | 109 |
| [CM] Other manufacturing industries | 9 | 104 | 104 | 110 |
- * NA: aggregated classification, based on the French classification of activities NAF rév.2.
- ** Weights used to aggregate sub-sectors balances of opinion.
- Source: INSEE - Monthly business tendency survey in industry
Documentation
Methodology (pdf,133 Ko)
Pour en savoir plus
Time series : Industry - Activity and demand
