


 29 September 2017
2017- n° 258At the end of Q2 2017, the Maastricht debt accounted for 99.2% of GDP Debt of the general government according to the Maastricht definition - second quarter
2017
29 September 2017
2017- n° 258At the end of Q2 2017, the Maastricht debt accounted for 99.2% of GDP Debt of the general government according to the Maastricht definition - second quarter
2017
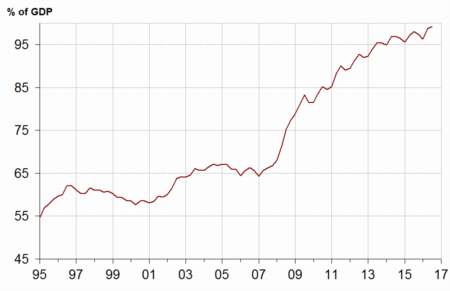
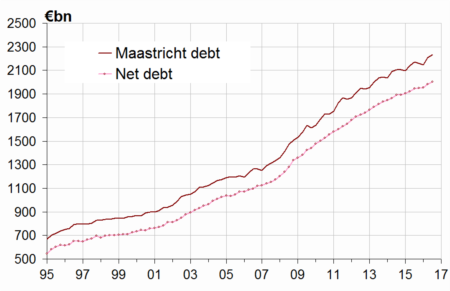
At the end of Q2 2017, the Maastricht debt amounted to €2,231.7 billion, a €22.0 billion increase in comparison to Q1 2017. It accounted for 99.2% of gross domestic product (GDP), 0.4 point higher than last quarter's level. The net public debt increased somewhat more moderately (€ +20.2 billion).
- The Maastricht debt increased by €22.0 billion compared to the previous quarter
- State debt went up while the central agencies' one decreased a little
- The debts of local government and social security funds debts decreased
- In Q2 2017, the net public debt increased by €20.2 billion
- The overall value of quoted shares and mutual fund shares held by general government increased again

Warnings: Quarterly debt figures are based on an accounting data source less exhaustive than the annual accounts. Results may therefore be updated during several quarters.
Quarterly debt variations are not equal to the forecasted deficit for the current quarter. To obtain the deficit from the change in the Maastricht gross public debt, net acquisitions of financial assets and of liabilities excluded from the Maastricht debt definition must also be taken into consideration, as well as the fact that the Maastricht debt is in nominal value. Moreover, the quarterly deficit published by INSEE is seasonally and trading-day adjusted, which is not the case of the quarterly debt.
The Maastricht debt increased by €22.0 billion compared to the previous quarter
At the end of Q2 2017, the Maastricht debt amounted to €2,231.7 billion, a €22.0 billion increase in comparison to Q1 2017. It accounted for 99.2% of gross domestic product (GDP), 0.4 point higher than last quarter's level. The net public debt increased somewhat more moderately (€ +20.2 billion).
State debt went up while the central agencies' one decreased a little
In the second quarter of 2017, the State contribution to the debt increased by €31.0 billion. This rise stemmed mainly from long-term negotiable debt (€ +23.9 billion) and to a lesser extent from deposits at the French Treasury (€ +4.1 billion) and from the short-term negotiable debt (€ +2.9 billion). The amounts of loans on the liabilities side of the State are steady.
Conversely, the contribution of central agencies decreased slightly (€ −0.2 billion) thanks to the Caisse nationale des autoroutes (CNA).
The debts of local government and social security funds debts decreased
In Q2 2017, the contribution of local government to the debt went down by € −0.9 billion: municipalities reduced their debt by €0.5 billion and departments by €0.4 billion.
The contribution of social security funds to the debt also decreased (€ −7.9 billion), above all because of CADES (€ −6.9 billion) that reimbursed espacially for € 3.8 billion Eurobonds and for € 1.4 billion negotiable debt securities.
To a lesser extent, ACOSS (€ –0.8 billion), UNEDIC (€ −0.2 billion) and Pôle Emploi (€ −0.2 billion) reduced their debt. Conversely, CNAF increased its debt (€ +0.2 billion) and hospitals too (€ +0.1 billion).
graphiqueGraphIR – General government debt under the Maastricht treaty (% of GDP) (*)
tableauTableauA – General government debt under the Maastricht treaty by sub-sector and by category
| 2016Q2 | 2016Q3 | 2016Q4 | 2017Q1 | 2017Q2 | |
|---|---|---|---|---|---|
| General Government | 2 171.2 | 2 161.0 | 2 147.4 | 2 209.7 | 2 231.7 |
| %of GDP | 98.1% | 97.4% | 96.3% | 98.8% | 99.2% |
| of which, by sub-sector : | |||||
| State | 1 724.5 | 1 722.2 | 1 709.9 | 1 759.4 | 1 790.4 |
| Central agencies | 18.7 | 17.2 | 12.7 | 11.7 | 11.5 |
| Local Government | 194.7 | 193.1 | 199.6 | 198.4 | 197.5 |
| Social security funds | 233.3 | 228.5 | 225.2 | 240.2 | 232.4 |
| of which, by category | |||||
| Currency and deposits | 37.3 | 38.1 | 36.5 | 32.8 | 37.0 |
| Securities other than shares | 1 843.9 | 1 836.6 | 1 817.3 | 1 887.7 | 1 909.1 |
| short-term | 194.5 | 180.3 | 168.0 | 195.8 | 198.3 |
| long-term | 1 649.3 | 1 656.3 | 1 649.3 | 1 691.8 | 1 710.8 |
| Loans | 290.1 | 286.3 | 293.6 | 289.2 | 285.6 |
| short-term | 15.0 | 12.6 | 13.3 | 12.2 | 10.3 |
| long-term | 275.1 | 273.8 | 280.3 | 277.0 | 275.3 |
- (*) Explanations in the box "For more details"
- Source : National Accounts 2010 basis - Insee, DGFiP, Banque de France
In Q2 2017, the net public debt increased by €20.2 billion
At the end of Q2 2017, the net public debt reached €2,002.0 billion (equivalent to 89.0% of GDP versus to 88.6% in Q1 2017), a €20.2 billion rise compared to the previous quarter. The €1.8 billion gap between changes in net and gross debt is mainly explained by an increase in the cash position of the State (€ +5.4 billion). Conversely, the cash position of social security funds (€ −2.5 billion) and central agencies (€ −0.7 billion) decreased. Furthermore the social security funds got €1.0 billion of short-term debt securities reimbursed and State lent € 0.7 billion to units outside of general government.
tableauTableauB – General government net debt by sub-sector
| 2016Q2 | 2016Q3 | 2016Q4 | 2017Q1 | 2017Q2 | |
|---|---|---|---|---|---|
| General government | 1 947.0 | 1 950.6 | 1 954.3 | 1 981.8 | 2 002.0 |
| of which : | |||||
| The State | 1 591.6 | 1 600.7 | 1 607.5 | 1 624.8 | 1 649.7 |
| Central agencies | 3.3 | 2.8 | –1.7 | –1.9 | –1.5 |
| Local government | 161.2 | 160.9 | 172.0 | 186.1 | 185.1 |
| Social security funds | 191.0 | 186.1 | 176.5 | 172.8 | 168.6 |
graphiqueGraph_dette_nette – Maastricht gross debt and net debt
The overall value of quoted shares and mutual fund shares held by general government increased again
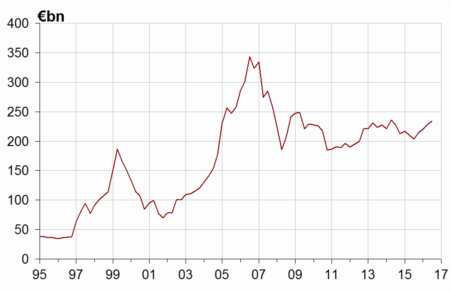
In Q2 2017, the overall value of quoted shares and mutual fund shares held by general government units went up to €233.7 billion, a €5.5 billion increase compared to Q1 2017. The quoted shares held by the State, e.g EDF and Aéroports de Paris, gained €6.0 billion of value due to the rise in stock market prices. The non-quoted shares held by the central agencies went up by €1.9 billion.
The value of mutual fund shares decreased (€ −2.5 billion), mainly because of the sale of money market fund shares by UNEDIC (€ −1.9 billion).
tableauTableauC – General government holdings of quoted shares and mutual fund shares
| 2016Q2 | 2016Q3 | 2016Q4 | 2017Q1 | 2017Q2 | |
|---|---|---|---|---|---|
| General government | 203.3 | 214.6 | 220.3 | 228.3 | 233.7 |
| of which : | |||||
| The State | 52.7 | 57.5 | 55.4 | 55.0 | 60.9 |
| Central agencies | 27.7 | 29.3 | 32.1 | 33.1 | 35.3 |
| Local government | 0.1 | 0.1 | 0.1 | 0.1 | 0.1 |
| Social security funds | 122.7 | 127.7 | 132.5 | 140.0 | 137.4 |
graphiqueGraph_F5 – General government holdings of quoted shares and mutual fun shares
Pour en savoir plus
