


 14 September 2017
2017- n° 241In August 2017, the prices of frequently purchased goods rose by 0.2% in hyper and
supermarkets Price Index in large and predominantly-food stores - August 2017
14 September 2017
2017- n° 241In August 2017, the prices of frequently purchased goods rose by 0.2% in hyper and
supermarkets Price Index in large and predominantly-food stores - August 2017
In August 2017, the prices of frequently purchased goods in hyper and supermarkets and in large and predominantly food stores accelerated slightly over a month: +0.2% after +0.1% in the previous month.
In August 2017, the prices of frequently purchased goods in hyper and supermarkets and in large and predominantly food stores accelerated slightly over a month: +0.2% after +0.1% in the previous month.
Excluding hyper and supermarkets, prices also rose a little faster than in July (+0.3% after +0.2%).
Considering all the kinds of stores, the prices of frequently purchased goods increased at a slightly faster pace, to +0.2% from +0.1% in July.
Year on year, prices accelerated again in hyper and supermarkets
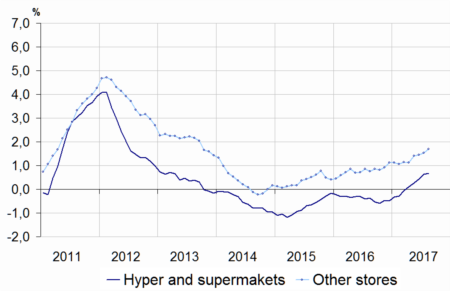
Compared with the same month last year, the prices of frequently purchased goods sold in hyper and supermarkets prices rose again in August (+0.7% after +0.6% in July), continuing the upward movement started in April 2017. Their decline, which had begun in November 2013, had gradually eased since November 2016. The same is true in large and predominantly food stores (+0.7% after +0.6% in the previous month).
In the other kinds of stores, the prices of frequently purchased goods remained more dynamic than in large distributors: in August, they increased by 1.7% year on year, 0.2 points above the previous month.
Considering all stores, the prices of frequently purchased goods rose slightly faster than in the previous month: +0.7% year on year after +0.6%.
graphiqueGraph1 – Prices of frequently purchased goods year-on-year change %
- Geographical coverage: metropolitan France
- Source: INSEE - Consumer Price Indexes
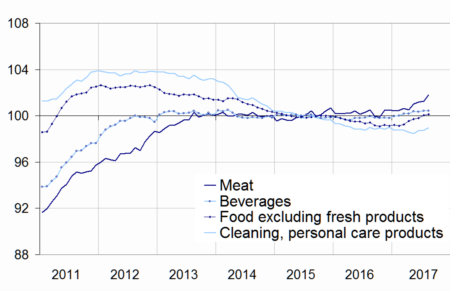
graphiqueGraph2 – Frequently purchased goods price indexes by main items
- Geographical coverage: metropolitan France
- Source: INSEE - Consumer Price Indexes
tableauTable1 – Prices of frequently purchased goods
| Index | Changes (%) compared to | ||
|---|---|---|---|
| August 2017 | last month (m-o-m) | 12 months before (y-o-y) | |
| Hyper and supermarkets (A) | 100.36 | 0.2 | 0.7 |
| Large and predominantly food stores (A + neighborhood stores) | 100.39 | 0.2 | 0.7 |
| Other stores | 102.64 | 0.3 | 1.7 |
| All stores | 100.70 | 0.2 | 0.7 |
- Geographical coverage: metropolitan France
- Source: INSEE - Consumer Price Indexes
tableauTable2 – Prices of frequently purchased goods detailed by main items
| Index | Changes (%) compared to | ||
|---|---|---|---|
| August 2017 | last month (m-o-m) | 12 months before (y-o-y) | |
| Food and beverages (excluding fresh foodstuffs) | 100.64 | 0.2 | 0.8 |
| - Meat | 101.82 | 0.5 | 1.3 |
| - Beverages | 100.42 | 0.0 | 0.5 |
| - Other food products | 100.14 | 0.1 | 0.7 |
| Clearing and personal care products | 98.94 | 0.2 | −0.1 |
| Total Hyper and supermarkets | 100.36 | 0.2 | 0.7 |
- Geographical coverage: metropolitan France
- Source: INSEE - Consumer Price Indexes
Further acceleration in food prices in hyper and supermarkets year on year
In August 2017, the prices of food excluding fresh products sold in hyper and supermarkets rose at the same moderate pace as in the previous month (+0.2%). Year on year, they continued to gather pace (+0.8% after +0.7% in July).
The rise in prices over a month resulted from a marked acceleration in meat prices, offset by a slowdown in those of other food products.
After a slight slowdown in July, meat prices sped up sharply in August (+0.5% after +0.1%). Year on year, they also accelerated, rising by 1.3% after +1.0% in July– the strongest increase since February 2014.
The prices of beverages sold in hyper and supermarkets were stable in August (+0.1% in July). Year on year, they increased a little less than in the previous month (+0.6% after +0.5%).
The prices of other food products (excluding fresh food) slowed down a little (+0.1% after +0.2%). Year on year, they rose at the same pace as in the previous month (+0.7%).
Further rise in the prices of cleaning and personal care products in hyper and supermarkets
The prices of cleaning and personal care products sold in hyper and supermarkets grew slightly more than in July (+0.2% after +0.1%). Year on year, the prices of these products edged down (−0.1%) after a stability in the previous month.
Pour en savoir plus
