


 14 September 2017
2017- n° 239Downturn in business start-ups in August 2017 Enterprise births - August 2017
14 September 2017
2017- n° 239Downturn in business start-ups in August 2017 Enterprise births - August 2017
In August 2017, the number of business births for all entreprises slipped back (−1.0% after +4.6% in July, seasonally and working-day adjusted). This was due to a decline in micro-entrepreneurs' registrations (−3.8%) following a large rise in July (+10.8%). As for start-ups excluding self-managed micro-entrepreneurs, they continued to rise (+1.0% after +0.5%).
In August 2017, the number of business births for all entreprises slipped back (−1.0% after +4.6% in July, seasonally and working-day adjusted). This was due to a decline in micro-entrepreneurs' registrations (−3.8%) following a large rise in July (+10.8%). As for start-ups excluding self-managed micro-entrepreneurs, they continued to rise (+1.0% after +0.5%).
graphiqueGraph1 – Business start-ups (SA-WDA *)
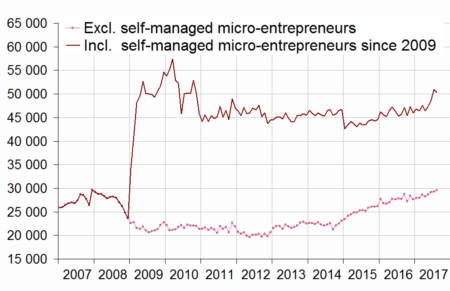
- * Seasonally and working-day adjusted data
- Source: INSEE (Sirene)
tableauTable1 – Business set-ups by month (SA-WDA *)
| May 2017 | June 2017 | July 2017 | Aug. 2017 | |
|---|---|---|---|---|
| Excl. self-managed micro-entrepreneurs | 28,661 | 29,161 | 29,293 | 29,575 |
| Variation [m-o-m] % | 1.4 | 1.7 | 0.5 | 1.0 |
| Incl. self-managed micro-entrepreneurs | 47,337 | 48,654 | 50,889 | 50,358 |
| Variation [m-o-m] % | 2.0 | 2.8 | 4.6 | -1.0 |
- * Seasonally and working-day adjusted data
- Source: INSEE (Sirene)
+7.2% year on year (three months basis)
Compared to the same period one year before, the raw amount of births added up in the last three months grew sharply (+7.2% in raw data). Micro-entrepreneurs' registrations speeded up (+12.5% after +6.4%) as well as company births (+6.4% after +5.4%). Sole proprietorship start-ups excluding micro-entrepreneurs went up too but at a slower pace (+1.0%). Business support activities and transportation were the sectors that contributed the most to the overall rise1.
tableauTable2 – Cumulated business start-ups by type
| Moving total % change * | Moving total | Moving total | ||
|---|---|---|---|---|
| over 3 months | over 12 months | January- August 2017 | January- August 2016 | |
| Total | 7.2 | 3.5 | 383,371 | 368,964 |
| Companies | 6.4 | 5.4 | 133,439 | 126,647 |
| Sole proprietorships (SP) | 7.7 | 2.5 | 249,932 | 242,317 |
| SP excluding self-managed micro-entrepreneurs | 1.0 | 3.7 | 98,663 | 96,041 |
| Self-managed micro-entrepreneurs | 12.5 | 1.7 | 151,269 | 146,276 |
- * Total of business start-ups during the last 3 or 12 months compared with the same months a year earlier
- Source: INSEE (Sirene)
+3.5% over the last twelve months
The raw number of business start-ups totted up during the last twelve months kept increasing (+3.5%). All types of business start-ups went up, particularly company births (+5.4%), sole proprietorship start-ups excluding self-managed micro-entrepreneurs (+3.7%) and, at a lesser extent, micro-entrepreneurs' registrations (+1.7%).
Two business set-ups out of five are self-managed micro-entrepreneurs' registrations
In August 2017, the share of micro–entrepreneurs' registrations in the businesses set up over the last twelve months edged up for the second month in a row and amounted to 40.1%.
tableauTable0 – Business set-ups distribution by type
| June 2017 | July 2017 | Aug. 2017 | |
|---|---|---|---|
| Companies | 34.5 | 34.5 | 34.4 |
| Sole proprietorships excluding self-managed micro-entrepreneurs | 25.8 | 25.6 | 25.5 |
| Self-managed micro-entrepreneurs | 39.7 | 39.9 | 40.1 |
- Source: INSEE (Sirene)

1 The contribution of a sector to the overall variation is the variation observed in this sector, weighted by the share of this sector in the total number of births.
Revisions
The variation in the overall number of business births in July 2017 has been lowered by 0.3 points to +4.6% due to the revision of raw data and the update of the SA-WDA parameters.
Business set-ups by economic activity
graphiqueGraph2 – Trade and business support activities start-ups (SA-WDA *)
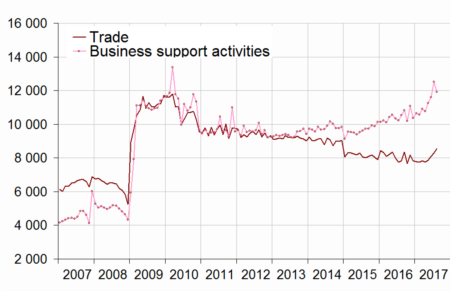
- * Seasonally and working-day adjusted data
- Source: INSEE (Sirene)
graphiqueGraph3 – Construction and transportation business set-ups (SA-WDA *)
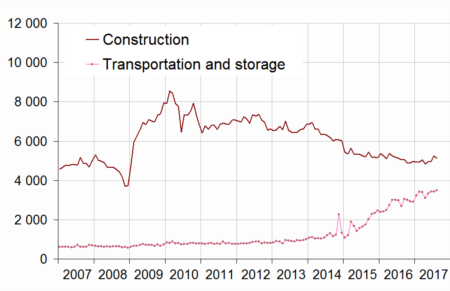
- * Seasonally and working-day adjusted data
- Source: INSEE (Sirene)
tableauTable3 – Number of business set-ups (incl. self-managed micro-entrepreneurs)
| NA | June 2017 | July 2017 | Aug. 2017 | |
|---|---|---|---|---|
| Total | 48,654 | 50,889 | 50,358 | |
| Industry | BE | 2,007 | 2,152 | 2,122 |
| Of which Manufacturing | C | 1,742 | 1,900 | 1,864 |
| Construction | FZ | 4,963 | 5,252 | 5,131 |
| Wholesale and retail trade, Transport, Accommodation and Food and beverage activities | GI | 14,159 | 14,411 | 14,631 |
| Trade | G | 8,107 | 8,298 | 8,545 |
| Transportation and storage | H | 3,436 | 3,427 | 3,499 |
| Accommodation and food service activities | I | 2,616 | 2,686 | 2,587 |
| Information and communication | JZ | 2,441 | 2,578 | 2,488 |
| Financial and insurance activities | KZ | 1,335 | 1,395 | 1,371 |
| Real estate activities | LZ | 1,880 | 1,959 | 1,989 |
| Business support activities | MN | 11,604 | 12,513 | 11,914 |
| Public administration and defence, education, human health and social work activities | OQ | 5,943 | 5,968 | 6,234 |
| Other services activities | RS | 4,323 | 4,662 | 4,479 |
- * Seasonally and working-day adjusted data
- Source: INSEE (Sirene)
tableauTable4 – Fluctuation in the number of business set-ups (incl. self-managed micro-entrepreneurs)
| NA | August 17 / July 17 | Moving total % change** | ||
|---|---|---|---|---|
| SA-WDA * | over 3 months | over 12 months | ||
| Total | -1.0 | 7.2 | 3.5 | |
| Industry | BE | -1.4 | 1.9 | 0.2 |
| Of which Manufacturing | C | -1.9 | 1.5 | -2.0 |
| Construction | FZ | -2.3 | -3.2 | -5.6 |
| Wholesale and retail trade, Transport, Accommodation and Food and beverage activities | GI | 1.5 | 6.5 | 4.0 |
| Trade | G | 3.0 | 4.0 | -2.4 |
| Transportation and storage | H | 2.1 | 16.9 | 25.3 |
| Accommodation and food service activities | I | -3.7 | 3.1 | 3.4 |
| Information and communication | JZ | -3.5 | 6.9 | 4.0 |
| Financial and insurance activities | KZ | -1.7 | 3.1 | 2.6 |
| Real estate activities | LZ | 1.5 | 20.9 | 11.2 |
| Business support activities | MN | -4.8 | 15.2 | 7.5 |
| Public administration and defence, education, human health and social work activities | OQ | 4.5 | 3.7 | 4.5 |
| Other services activities | RS | -3.9 | 7.1 | 0.3 |
- * Seasonally and working-day adjusted data
- ** Total of business start-ups during the last 3 or 12 months compared with the same months a year earlier
- Source: INSEE (Sirene)
Pour en savoir plus
Time series : Business demography
