


 31 August 2017
2017- n° 235In July 2017, overall agricultural prices rose by 1.0% over one year Indices of agricultural prices - July 2017
31 August 2017
2017- n° 235In July 2017, overall agricultural prices rose by 1.0% over one year Indices of agricultural prices - July 2017
In July 2017, overall agricultural products prices remained higher than last year but this rise lessened: +1.0% over one year, after +2.9 % in June and +5.2% in May. Excluding fruits and vegetables, they decreased by 0.3% over one month and climbed by 3.4% over one year (after +3,8% in June).
In July 2017, overall agricultural products prices remained higher than last year but this rise lessened: +1.0% over one year, after +2.9 % in June and +5.2% in May. Excluding fruits and vegetables, they decreased by 0.3% over one month and climbed by 3.4% over one year (after +3,8% in June).
Rise in cereals and oilseed prices
In July 2017, overall cereal prices continued to increase (+1.3% after +2.8%) while oilseed prices rebounded (+1.2% after a cumulative decline of 11.5% from April to June). The dry weather conditions in the United States and Canada until July raised fear about yield drops for wheat and rape. Nevertheless, maïze prices retreated over one month (−3.9%) and over one year alike (−2.4%). The Ukrainian and South American competition on the European marked weighed on the price and volume of production of maïze.
graphiqueGraph1 – Producer prices of cereals
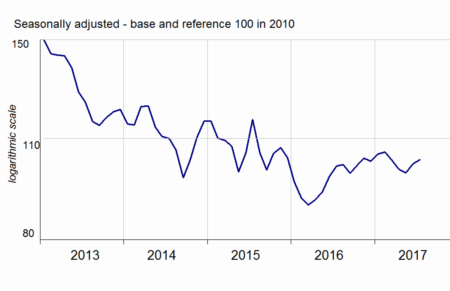
- Source: INSEE
Strong drop in fresh vegetable and fruit prices
In July 2017, the prices of summer fruits and vegetables (peach, apricot, tomato et melon) plunged owing to an ample European supply. The high temperatures at the end of the spring noticeably accelarated the maturity of the French products. Indeed, fresh fruit prices declined by 16.1% over one year in July (after −12.4%) and fresh vegetable prices by 28.9% (after +1,1% in June).
graphiqueGraph2 – Producer prices of fresh vegetables
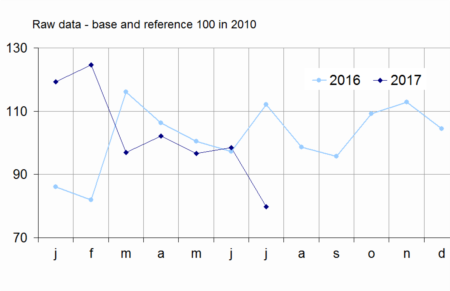
- Source: SSP (ministry in charge of agriculture)
Falling animal prices in July, rising milk price over one year
In July, animal prices kept on decreasing overall compared to the previous month (−1.5% after −1.3%; +2.9% over one year). Over the last three months, pig price declined sharply (−11.3 %) owing to a large retreat in Chinese demand. Cattle prices declined too.
graphiqueGraph3 – Producer prices of pigs and large cattle
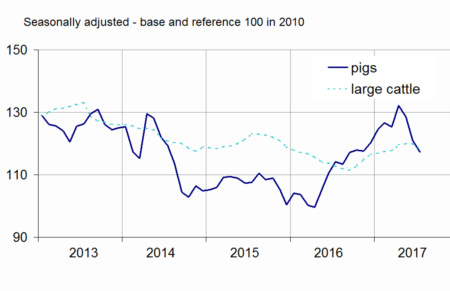
- Source: INSEE
Cow milk price declined from April to June (−1.6%) but still remained on the rise over one year (+16.1 % from July 2016 to June 2017). Until May, high global demand for dairy products, butter and cheese, had been sustaining the cow milk price paid to producers. But the surplus of skim milk powder, by-product of butter, has weighed since then on the raw material price paid to producers.
tableautable1 – Indice of producer prices of agricultural products (IPPAP)
| Variation as % over | |||||
|---|---|---|---|---|---|
| Weights | July 2017 | a month | 3 months | a year | |
| Agricultural goods output | 1000 | 114.4 | /// | /// | +1.0 |
| excluding fruits and vegetables | 900 | 117.2 | –0.3 | –1.3 | +3.4 |
| Crop output (excluding fruits and vegetables) | 505 | 121.0 | +0.5 | +0.2 | +0.7 |
| Cereals | 188 | 102.8 | +1.3 | +3.0 | +2.1 |
| of which soft wheat | 112 | 101.1 | +1.8 | +4.6 | +2.4 |
| grain maize | 41 | 94.9 | –3.9 | –6.4 | –2.4 |
| Potatoes | 26 | 231.3 | /// | /// | +0.7 |
| Wines | 177 | 135.0 | +0.2 | +1.9 | –0.1 |
| protected designation of origin | 84 | 148.1 | +0.2 | +3.1 | +1.3 |
| other wines | 23 | 133.9 | +0.6 | +1.0 | –7.0 |
| Oleaginous | 49 | 96.5 | +1.2 | –7.6 | +0.4 |
| Horticultural products | 30 | 110.3 | 0.0 | –0.8 | –0.2 |
| Other crop products | 36 | 110.3 | –0.4 | –0.7 | +1.6 |
| Fruits and vegetables (1) | 100 | 88.9 | /// | /// | –21.3 |
| Fresh vegetables | 53 | 79.7 | /// | /// | –28.9 |
| Fresh fruits | 35 | 95.7 | /// | /// | –16.1 |
| Animal output | 395 | 112.3 | –1.4 | –3.3 | +7.3 |
| Animals | 234 | 114.4 | –1.5 | –3.4 | +2.9 |
| of which large cattle | 96 | 118.3 | –1.4 | –1.1 | +4.8 |
| calves | 26 | 99.0 | –3.8 | –8.5 | –3.2 |
| pigs | 54 | 117.3 | –3.1 | –11.3 | +2.7 |
| sheep | 10 | 126.0 | +3.4 | +13.6 | +10.1 |
| poultry | 46 | 109.1 | +0.1 | +1.1 | 0.0 |
| of which chicken | 28 | 109.1 | +0.1 | +1.9 | +0.2 |
| Milk | 147 | 108.2 | /// | –1.5 | +14.9 |
| of which cow milk (2) | 137 | 107.9 | /// | –1.6 | +16.1 |
| Eggs | 15 | 120.4 | –10.7 | –15.9 | +15.3 |
- * Except for fresh fruits, fresh vegetables and potatoes
- /// Absence of meaning due to the nature of these series
- (1) Including vegetables for industry.
- (2)The June value of cow milk price indice has been carried forward in July.
- Sources: INSEE, SSP (ministry in charge of agriculture)
Slight decline in purchase prices of means of production
En July 2017, intermediate consumption prices still decreased (−0.2% after −0.9%), mainly reflecting a further drop in fertilisers prices (−1.5%), partly offset by a rebound in energy prices (+0.9%). Capital goods prices, virtually stable in July (−0.1%), increased by 2.2% over one year.
Revision
The variation over one year of IPPAP has been lowered by 0.3 points in June to +2,9%; that of IPAMPA has been raised by 0.1 points to +0.3%.
graphiqueGraph4 – Purchase prices of the means of agricultural production
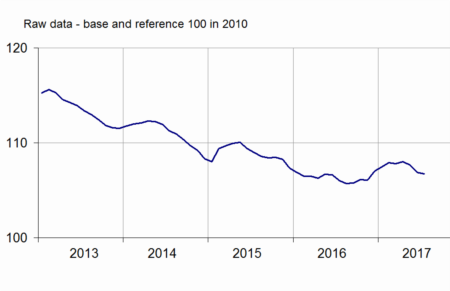
- Sources: INSEE, SSP (ministry in charge of agriculture)
tableautable2 – Indices of purchase prices of the means of agricultural production (IPAMPA)
| Variation as % over | |||||
|---|---|---|---|---|---|
| Weights | July 2017 | a month | Weights | June 2017 | |
| Total input | 1000 | 106.7 | –0.2 | –1.2 | +0.7 |
| Intermediate consumptions | 764 | 105.9 | –0.2 | –1.9 | +0.2 |
| Energy | 100 | 94.9 | +0.9 | –6.0 | +2.9 |
| Seeds | 57 | 106.0 | –0.4 | –0.5 | –2.0 |
| Fertilisers and soil improvers | 92 | 97.6 | –1.5 | –7.7 | –2.7 |
| Plant protection products | 78 | 97.9 | –0.5 | –0.4 | –1.2 |
| Animal feed | 205 | 113.0 | –0.2 | –0.7 | +0.4 |
| Veterinary expenses | 43 | 120.0 | +0.3 | +0.4 | +1.4 |
| Small equipment and tools | 17 | 107.5 | +0.3 | +0.5 | –1.6 |
| Maintenance of materials | 67 | 115.6 | 0.0 | +0.3 | +1.6 |
| Maintenance of buildings | 9 | 108.5 | 0.0 | 0.0 | +1.5 |
| Other goods and services | 97 | 102.7 | +0.1 | 0.0 | +0.5 |
| Goods and services contributing to investment | 236 | 109.5 | –0.1 | +1.0 | +2.2 |
| Material | 186 | 110.6 | –0.1 | +1.1 | +2.3 |
| Tractors | 79 | 112.7 | –0.4 | +2.2 | +3.8 |
| Machinery and equipment for cultivation | 36 | 111.5 | –0.3 | +0.2 | +1.5 |
| Machinery and equipment for harvesting | 42 | 109.5 | –0.1 | +0.1 | +1.4 |
| Utility vehicles | 18 | 105.0 | +0.8 | +0.5 | +0.7 |
| Buildings | 50 | 105.2 | 0.0 | +0.4 | +2.0 |
- (1) The repayment of the domestic tax on energy product (TICPE) benefiting farmers has been applied in advance for the year 2017.
- Sources: INSEE, SSP (ministry in charge of agriculture)
Documentation
Methodology (pdf,122 Ko)
Pour en savoir plus
Time series : Indices of agricultural prices
