


 31 August 2017
2017- n° 230In Q2 2017, producer prices for services sold to French businesses increased by 0.5% Services producer price indices - second quarter 2017
31 August 2017
2017- n° 230In Q2 2017, producer prices for services sold to French businesses increased by 0.5% Services producer price indices - second quarter 2017
In the second quarter of 2017, producer prices of services sold to French businesses went up by 0.5%, after edging down in the beginning of the year (−0.2%). Year over year, they rose by 0.4%, as in the previous quarter.
- SPPI, production sold to French businesses
- Rise in prices for most services in the second quarter
- Stability in prices for information-communication services and for scientific and technical services
- SPPI, production sold to households in France
- SPPI, production sold on foreign markets
- SPPI (all markets)
SPPI, production sold to French businesses
In the second quarter of 2017, producer prices of services sold to French businesses went up by 0.5%, after edging down in the beginning of the year (−0.2%). Year over year, they rose by 0.4%, as in the previous quarter.
Rise in prices for most services in the second quarter
After three quarters of virtual stability, prices for admistrative and support services picked up in the second quarter 2017 (+0.7% ; +0.8% year over year), especially because of the rise in prices for employment services (+1.4%).
Prices for transport and storage services gathered pace (+0.6% after +0.3%). This increase was driven by the impact of the petroleum price strengthening in the beginning of the year on prices for service activities incidental to transportation as well as by a lesser competition in sea and coastal water freight transport services.
Prices for accomodation-food services recovered seasonally (+1.6% after −1.0% ; −0.8% year over year).
Lastly, prices for real estate activities picked up slightly (+0.7% after +0.5% ;+2.4% year over year), mainly thanks to renting and operating services of own or leased real estate.
Stability in prices for information-communication services and for scientific and technical services
Prices for information-communication services were stable in the second quarter 2017 (after −0.7% in the first quarter ; −0.2% year over year) as well as those for scientific and technical services (after −0.1% ; −0.9% year over year).
SPPI, production sold to households in France
In the second quarter of 2017, producer prices of services sold to households in France gathered pace (+0.5% after +0.3% ; +1.0% year over year) mainly because of rises in prices for transport and storage services (+1.3%) and for real estate activities (+0.5%). Only prices for administrative and support services declined (−0.9% ; −1.3% year over year).
SPPI, production sold on foreign markets
After two quarters of stability, export prices rose anew (+0.4%). This rise in prices is due to an increase in prices of transport and storage services (+1.6%), partially offset by a decline in prices of scientific and technical services (−0.5%) and administrative and support services (−0.3%).
SPPI (all markets)
In the second quarter of 2017, on all markets, producer prices of services sped up (+0.5% after 0.0%). Year over year, they remained quite buoyant: +0.7% after 0.6%.
graphiqueGraphique1 – Producer price indices for all services
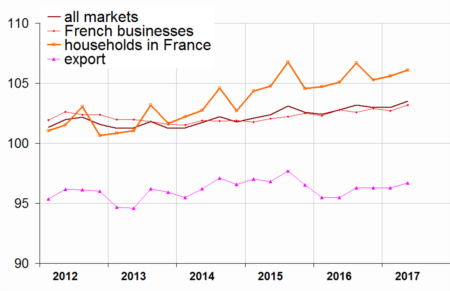
- Source: INSEE
graphiqueGraphique2 – Producer price indices of services sold to French businesses
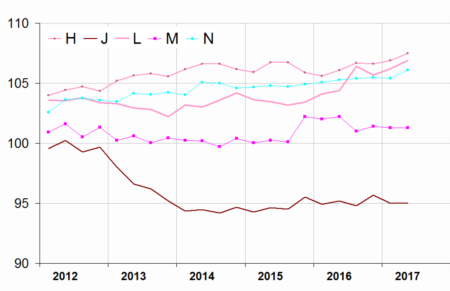
- Source: INSEE
graphiqueGraphique3 – Services producer price indices, all markets
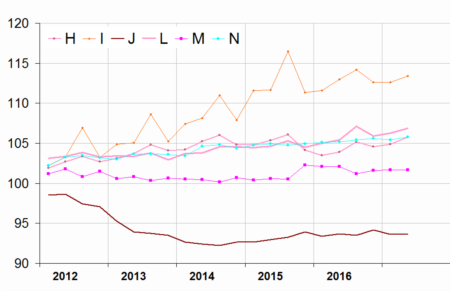
- Source: INSEE
tableauTableau1 – Services producer price indices, by sector:
| Sections and choices of | Weight | Indices | Change in % | |
|---|---|---|---|---|
| levels in NAF rev.2 | 2017Q02 | Q/Q-1 | Q/Q-4 | |
| Prices of services sold to French businesses (BtoB) | ||||
| HN : all services | 1000 | 103.2 | 0.5 | 0.4 |
| H : transport. and storage | 180 | 107.5 | 0.6 | 1.3 |
| 49 : land and pipeline transport | 81 | 106.1 | 0.1 | 1.1 |
| 52 : warehousing and auxiliary services for transport | 73 | 107.7 | 0.6 | 0.8 |
| I : accommodation and food | 44 | 112.3 | 1.6 | –0.8 |
| J : information and communic. | 237 | 95.0 | 0.0 | –0.2 |
| 62 : IT services | 92 | 102.1 | 0.1 | 0.1 |
| L : real estate activities | 103 | 106.9 | 0.7 | 2.4 |
| M : prof., scient. and tech. | 218 | 101.3 | 0.0 | –0.9 |
| 69 : Legal and accounting services | 46 | 103.9 | 0.0 | –0.8 |
| 70 : activities of head offices and management consulting services | 47 | 102.9 | –0.5 | –1.4 |
| 71 : Architectural and engineering services | 83 | 100.4 | 0.1 | –1.0 |
| 73 : Advertising and market research services | 26 | 98.9 | 0.9 | 0.5 |
| N : administ. and support serv. | 210 | 106.1 | 0.7 | 0.8 |
| 77 : renting & leasing services | 60 | 98.7 | –0.2 | –0.9 |
| 78 : employment services | 52 | 109.8 | 1.4 | 1.8 |
| 82 : Office administrative and support services | 46 | 109.7 | 1.4 | 1.7 |
| Prices of services sold to households in France (BtoC) | ||||
| HN : all services | 1000 | 106.1 | 0.5 | 1.0 |
| H : transport. and storage | 153 | 110.0 | 1.3 | 2.6 |
| I : accommodation and food | 255 | 114.0 | 0.4 | 1.0 |
| J : information and communic. | 179 | 91.5 | 0.3 | 0.5 |
| L : real estate activities | 284 | 106.9 | 0.5 | 0.5 |
| M : prof., scient. and tech. | 73 | 104.6 | 0.8 | 2.6 |
| N : administ. and support serv. | 42 | 97.0 | –0.9 | –1.3 |
| Export prices of services (BtoE) | ||||
| HN : all services | 1000 | 96.7 | 0.4 | 1.3 |
| H : transport. and storage | 313 | 93.4 | 1.6 | 2.8 |
| J : information and communic. | 148 | 81.0 | –0.1 | 0.5 |
| M : prof., scient. and tech. | 215 | 101.0 | –0.5 | 0.2 |
| N : administ. and support serv. | 314 | 105.3 | –0.3 | 0.9 |
| Prices of services sold on all markets (BtoAll) | ||||
| HN : all services | 1000 | 103.5 | 0.5 | 0.7 |
| H : transport. and storage | 189 | 105.8 | 0.9 | 1.8 |
| I : accommodation and food | 92 | 113.4 | 0.7 | 0.4 |
| J : information and communic. | 212 | 93.7 | 0.1 | 0.0 |
| L : real estate activities | 136 | 106.9 | 0.6 | 1.4 |
| M : scient. and tech. services | 181 | 101.7 | 0.0 | –0.4 |
| N : administ. and support serv. | 180 | 105.8 | 0.4 | 0.6 |
- s: statistical confidentiality
- BtoB: business to business
- BtoC: business to consumer
- BtoE: business to exports
- BtoAll: business to all
- Source: INSEE
tableauTableau3 – Revision of variations
| Services producer price indices | 2017T01 / 2016T04 |
|---|---|
| - services sold to all markets | –0,1 |
| - services sold to French businesses | –0,2 |
| - services sold to consumers in France | // |
| - export of services | // |
- How to read it: the change in the services price index for services sold to French businesses between the fourth quarter 2016 and the first quarter 2017 published at the end of May 2017 was 0.0%. It has been revised at –0.2%; that is to say a revision of (0.2 points.
- Source : INSEE
Documentation
Simplified methodology (pdf,134 Ko)
Pour en savoir plus
Time series : Services producer price indices
