


 25 August 2017
2017- n° 224In July 2017, oil price recovered barely Prices of oil and raw material imports - July 2017
25 August 2017
2017- n° 224In July 2017, oil price recovered barely Prices of oil and raw material imports - July 2017
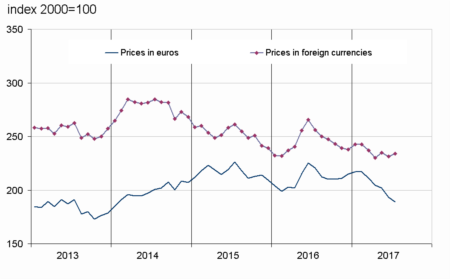
In July 2017, the price of crude oil in euros recovered barely (+0.6% after −8.8%). The prices in euros of all other imported commodities were virtually stable, after a four-month decrease (−0.2% after −4.3%). The prices of industrial raw materials picked up (+1.6% after −4.2%) and those of raw food materials decreased less sharply than in June (−2.1% after −4.4%).
In July 2017, the price of crude oil in euros recovered barely (+0.6% after −8.8%). The prices in euros of all other imported commodities were virtually stable, after a four-month decrease (−0.2% after −4.3%). The prices of industrial raw materials picked up (+1.6% after −4.2%) and those of raw food materials decreased less sharply than in June (−2.1% after −4.4%).
Oil price recovered a little
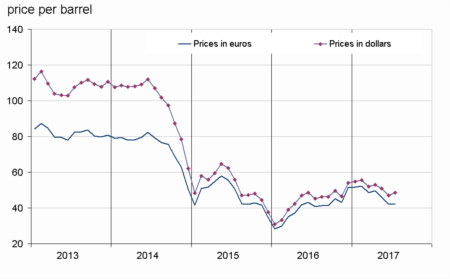
In July 2017, the price of North Sea crude oil (Brent) in euros recovered slightly (+0.6% after –8.8%). It reached an average of €42.2 per barrel. In dollars, the rebound was more marked (+3.2% after −7.4%) because the euro appreciated again during the month.
graphiqueGraph1 – Oil (Brent)
- Source : INSEE
tableauTable1 – Oil and petroleum products
| Prices | Change (%) | |||
|---|---|---|---|---|
| of last month | over the last month | over the last 3 months | over the last 12 months | |
| Brent in $ per barrel | 48.6 | 3.2 | –8.4 | 7.9 |
| Brent in € per barrel | 42.2 | 0.6 | –14.7 | 3.6 |
| Gasoline €/L | 0.362 | 5.6 | –9.8 | 11.1 |
| Gas Oil | 393.1 | 4.0 | –12.1 | 7.3 |
| Heavy fuel | 286.2 | 0.2 | –4.0 | 31.6 |
| Naphtha | 362.3 | 0.7 | –18.3 | 4.1 |
- Prices are in euros per tonne unless otherwise specified
- Source : INSEE
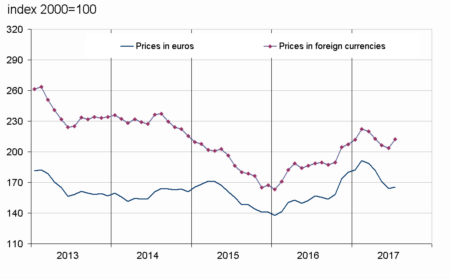
Industrial commodity prices recovered slightly
In July 2017, the prices in euros of industrial raw materials recovered somewhat (+0.9% after −4.2%). This increase was due to a rebound in minerals prices (+1.8% after −4.3%) mainly because of the iron ore (+14.1 after −9.0%). The prices of non-ferrous metals were virtually stable (−0.2%) after a sharp decline (−7.6% over the last three months). The decrease in the prices of precious metals was steeper (−5.6% after −1.3%). The prices of agro-industrial raw materials declined less sharply than in the previous month (−2.5% after −3.9%). Notably, the price of tropical wood declined less than in June (−1.8% after −4.0%), as those of natural fibres (−3.9% after −5.9%). However, the price of wood pulp fell back (−2.8% after +0.4%) and hide ones plummeted further (−8.6% after −4.3%). Only the price of natural rubber bounced back (+2.6% after −8.0%), due to a lacking supply.
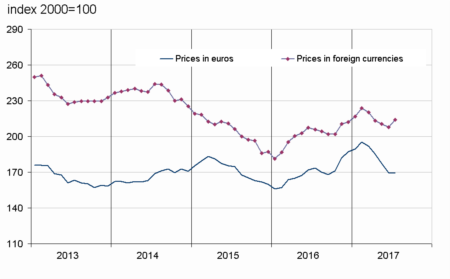
Food commodity prices decreased less sharply than in June
In euros, the prices of raw food materials decreased less sharply than in June (−2.1% after −4.4%). Nevertheless, they reached their lower level since January 2014. The prices of tropical foodstuffs declined less than in June (−2.2% after −4.2%). The prices of oil seeds and vegetable oils recovered (+1.8% after −5.4%), as well as those of sugar (+1.0% after −16.4%) as a result of the Brazilian real appreciation. In contrast, the prices of cereals retreated (−1.8% after +3.4%) and the price of beef meat plummeted (−11.7% after −4.1%).
tableauTable2 – Imported raw materials (excluding energy) in euros
| Index | Changes (%) | |||
|---|---|---|---|---|
| of last month | over the last month | over the last 3 months | over the last 12 months | |
| Food total | 189.1 | –2.1 | –7.6 | –14.3 |
| Tropical foodstuffs | 161.0 | –2.2 | –9.8 | –25.4 |
| Oil seeds, vegetable oils | 218.8 | 1.8 | –4.6 | –11.1 |
| Cereals | 158.6 | –1.8 | 2.9 | –3.4 |
| Sugar | 134.2 | 1.0 | –21.3 | –32.7 |
| Beef meat | 141.4 | –11.7 | –13.8 | –2.6 |
| Industrial raw materials | 165.4 | 0.9 | –9.1 | 5.5 |
| Agricultural raw materials | 121.0 | –2.5 | –10.5 | 3.6 |
| Natural Fibres | 139.1 | –3.9 | –11.0 | –0.3 |
| Natural rubber | 142.4 | 2.6 | –13.8 | 4.0 |
| Hides | 62.2 | –8.6 | –22.3 | –18.7 |
| Wood pulp | 102.5 | –2.8 | –3.4 | 3.0 |
| Tropical wood | 91.9 | –1.8 | –6.5 | –7.3 |
| Sawn softwood | 112.7 | –3.2 | –17.3 | 6.9 |
| Minerals | 189.4 | 1.8 | –8.7 | 5.9 |
| Iron ore | 430.3 | 14.1 | –11.9 | 13.6 |
| Non-ferrous metals | 155.5 | –0.2 | –7.6 | 6.3 |
| Precious metals | 227.6 | –5.6 | –12.4 | –15.8 |
| All commodities | 169.4 | –0.2 | –8.6 | –2.4 |
- Source : INSEE
graphiqueGraph3 – Food
- Source : INSEE
graphiqueGraph2 – Imported raw materials (excluding energy)
- Source : INSEE
graphiqueGraph4 – Industrial raw materials
- Source : INSEE
Pour en savoir plus
Time series : Raw materials prices
