


 28 July 2017
2017- n° 203Household consumption expenditure on goods withdrew in June 2017 (−0.8%) but bounced
back over the second quarter (+0.4%) Household consumption expenditure on goods - June 2017
28 July 2017
2017- n° 203Household consumption expenditure on goods withdrew in June 2017 (−0.8%) but bounced
back over the second quarter (+0.4%) Household consumption expenditure on goods - June 2017
In June 2017, households' expenditure on goods decreased by 0,8 % in volume terms* after two consecutive months of growth. However, they bounced back over the second quarter (+0.4% after −0.4%).
- Engineered goods: clear fall in June, slight growth over the quarter
- Durables: fall in June, acceleration over the quarter
- Textile-clothing: drop in June and over the quarter
- Other engineered goods: slight rise in June, contraction over the quarter
- Food products: declining again in June, accelerating slightly over the quarter
- Energy: slight dip in June, slight rebound over the quarter
- The variation in May 2017 is slightly revised downwards
In June 2017, households' expenditure on goods decreased by 0,8 % in volume terms* after two consecutive months of growth. However, they bounced back over the second quarter (+0.4% after −0.4%).

*Volumes are measured at chain-link previous year prices (2010 euro billions) and all figures are trading-day and seasonally adjusted.
graphiqueGraph1 – Total consumption of goods
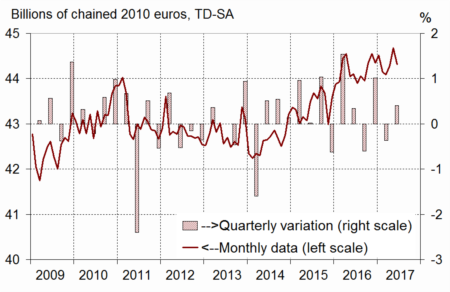
- Source: INSEE
Engineered goods: clear fall in June, slight growth over the quarter
In June 2017, purchases of engineered goods shrank (−1.0% after +1.2%). Over the whole quarter, they increased very slightly (+0.2%): the decline in textile-clothing expenses dampened the upturn in car purchases and the dynamism in purchases of household durables other than cars.
Durables: fall in June, acceleration over the quarter
In June, consumption of household durables other than cars, notably consumer electronic devices, decreased for the third consecutive month. It slowed down over the whole quarter (+0.9% after +1.8%).
Car purchases were virtually stable in June: the downturn in new vehicles was offset by an acceleration in purchases of second-hand and two-wheeled vehicles. Over the quarter, car purchases bounced back (+1.0% after −0.9%).
Textile-clothing: drop in June and over the quarter
In June, expenses on textile-clothing slipped back strongly (−4.7%). The fall was less dramatic over the whole quarter (−0.4%).
Other engineered goods: slight rise in June, contraction over the quarter
In June, purchases of « other engineered goods » recovered slightly (+0.3% after −0.1%), mainly thanks to the rebound of hardware's expenses. Over the whole quarter, these purchases fell back (−0.4% after a stability over the first quarter).
graphiqueGraph2 – Breakdown of engineered goods
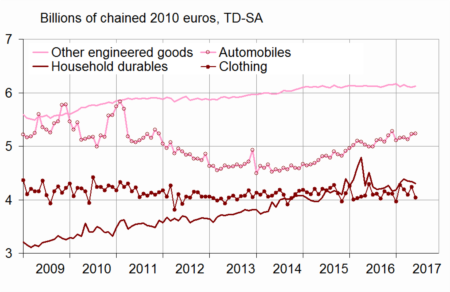
- Source: INSEE
Food products: declining again in June, accelerating slightly over the quarter
In June 2017, total consumption of food products decreased clearly (−0.8% after −0.1%). However, the consumption of tobacco was on the rise. Over the second quarter, food expenses accelerated slightly (+0.6% after +0.4%).
graphiqueGraph3 – Food products, engineered goods and energy
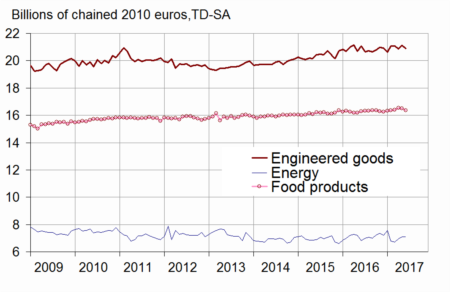
- Source: INSEE
Energy: slight dip in June, slight rebound over the quarter
In June 2017, energy consumption edged down (−0.2%), after two months of sustained growth. Expenses on gas and electricity declined; the ones on refined products increased (+0.7%) due to soaring purchases of heating oil while the consumption of any other type of fuel fell. Over the whole quarter, energy expenses rebounded slightly (+0.5%) after a steep fall in the first quarter (−3.2%).
graphiqueGraph4 – Breakdown of energy
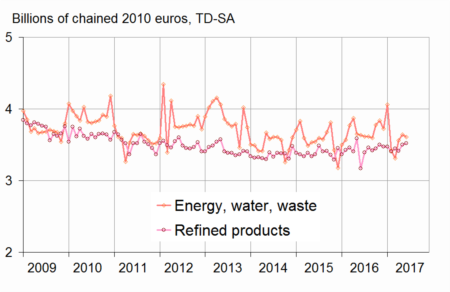
- Source: INSEE
The variation in May 2017 is slightly revised downwards
Compared to the previous estimate, the variation in household expenditure on goods in May 2017 has been revised downwards by 0.1 points, at +0.9%. Since the previous publication, new information has been integrated and the seasonal adjustment coefficients have been updated.
tableauTable – Household consumption expenditure on goods
| Weight (1) | April 17 | May 17 | June 17 | June. 17 / June. 16 | Q2 2017 / Q1 2017 | |
|---|---|---|---|---|---|---|
| Food products | 38 | 0.8 | –0.1 | –0.8 | 0.4 | 0.6 |
| - excl. Tobacco | 35 | 1.0 | –0.2 | –1.0 | 0.5 | 0.9 |
| Engineered goods | 45 | –1.0 | 1.2 | –1.0 | –0.8 | 0.2 |
| - Durables | 22 | –0.7 | 1.0 | –0.3 | 0.8 | 0.8 |
| Including : | ||||||
| - Automobiles | 12 | –0.7 | 2.0 | 0.1 | 4.8 | 1.0 |
| - Other household durables | 7 | –0.8 | –0.1 | –1.0 | –4.7 | 0.9 |
| - Textile-clothing | 9 | –2.4 | 3.6 | –4.7 | –5.9 | –0.4 |
| - Other engineered goods | 13 | –0.5 | –0.1 | 0.3 | 0.1 | –0.4 |
| Energy | 17 | 3.7 | 2.4 | –0.2 | 4.1 | 0.5 |
| - Energy, water, waste | 10 | 7.5 | 2.3 | –0.9 | –0.8 | 0.1 |
| - Refined Products | 7 | –1.0 | 2.5 | 0.7 | 11.1 | 1.0 |
| Total | 100 | 0.5 | 0.9 | –0.8 | 0.5 | 0.4 |
| - Including Manufactured goods | 84 | –0.4 | 0.7 | –0.7 | 0.7 | 0.2 |
- (1) Weighting in the consumption expenditure on goods in value in 2016
Documentation
Methodology (pdf,23 Ko)
Pour en savoir plus
