


 26 July 2017
2017- n° 199In July 2017, the economic climate continues to improve in civil engineering Quaterly survey of public works - July 2017
26 July 2017
2017- n° 199In July 2017, the economic climate continues to improve in civil engineering Quaterly survey of public works - July 2017
According to the business managers surveyed in July 2017, the economic climate in civil engineering is more favourable again than in the previous quarter. The return of confidence is confirmed: all balances of opinion have increased and stand above their long-term average.
According to the business managers surveyed in July 2017, the economic climate in civil engineering is more favourable again than in the previous quarter. The return of confidence is confirmed: all balances of opinion have increased and stand above their long-term average.
Business managers' opinion on their activity continues to improve
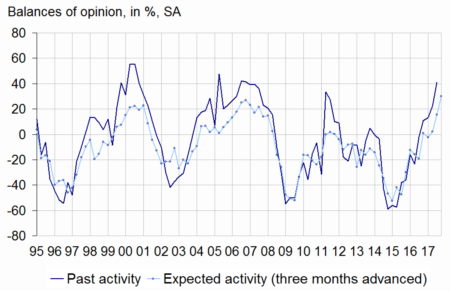
In July 2017, more business managers than in April have indicated an increase in their past activity, for both public-sector and private-sector projects. The corresponding balances of opinion are positive and above their long-term average. The one about past activity as a whole has reached its highest level since October 2006. Likewise, business managers are much more optimistic about their activity over the next three months, a majority of them anticipating a rise. The corresponding balance has reached a record level, far above its long-term average. The balances of opinion have risen for both public-sector and private-sector projects.
Otherwise, order books continue to fill up; the corresponding balance of opinion has improved and has become positive, far above its long-term average.
Stronger production constraints
In July 2017, many more business managers than in April have reported obstacles to production due to workforce shortage: 32% of businesses have indicated being hampered because of workforce shortage against 15% on long-term average.
Employment prospects improve again
Each quarter since April 2016, more and more business managers have forecast an increase in their workforce. The balance of opinion on expected workforce has continued to increase and stands significantly above its long-term average.
tableauTable1 – Public works economic outlook
| Mean* | Oct. 16 | Jan. 17 | April 17 | July 17 | |
|---|---|---|---|---|---|
| Past activity | –7 | 11 | 13 | 22 | 41 |
| - public-sector project | –13 | 1 | 1 | 12 | 28 |
| - private-sector project | –11 | 13 | 17 | 17 | 28 |
| Expected activity | –14 | –2 | 2 | 16 | 30 |
| - public-sector project | –18 | –13 | –9 | 10 | 19 |
| - private-sector project | –17 | 4 | 6 | 11 | 21 |
| Opinion on order books | –27 | –32 | –25 | –10 | 1 |
| Obstacles to production increase because of workforce shortage (in %) | 15 | 11 | 9 | 19 | 32 |
| Expected workforce | –16 | 3 | 6 | 12 | 32 |
- Note: the balances of opinion by costumer may differ from the balance of the whole, because sometimes the firms don't distinguish public-sector project and private-sector project. * Mean since January 1981
graphiqueGraph1 – Activity tendency in civil engineering
Pour en savoir plus
