


 25 July 2017
2017- n° 195In July 2017, the industrialists' opinion on past change of global and foreign demand
has significantly improved Quarterly business survey (goods-producing industries) - July 2017
25 July 2017
2017- n° 195In July 2017, the industrialists' opinion on past change of global and foreign demand
has significantly improved Quarterly business survey (goods-producing industries) - July 2017
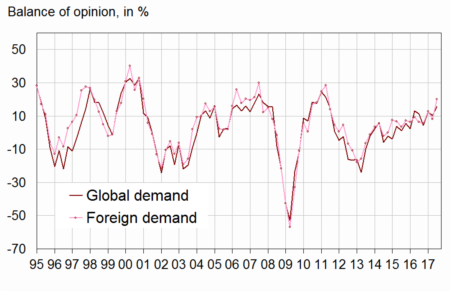
In July 2017, the balances of opinion on past change of global and foreign demand have sharply increased compared to April. They have reached their highest level since April 2011, significantly above their normal. For the next three months, business managers remain upbeat on global and foreign demand; the corresponding balances remain above normal.

Warning: In the survey of July 2017, the weights used to aggregate the responses of the business managers have been updated. The seasonal coefficients have also been updated.Consequently, the set of results previously published in this quarterly survey is subject to slight revisions.
Much more industrialists have indicated an increase in past demand
In July 2017, the balances of opinion on past change of global and foreign demand have sharply increased compared to April. They have reached their highest level since April 2011, significantly above their normal. For the next three months, business managers remain upbeat on global and foreign demand; the corresponding balances remain above normal.
graphiqueGraphang1_bis – Balance of opinion of past change in demand
Slight increase in the use of production capacity
In July 2017, the industrialists have reported that they used slightly more their machinery and equipment than in April. The production capacity utilisation rate has increased by 0.4 points during the past three months. At 84.3%, it has exceeded its average between 1995 and 2007.
A few more industrialists than in April consider that they could not produce more if they received more orders: production bottlenecks have increased, the corresponding indicator is significantly above its long-term average. The proportion of industrialists indicating difficulties of supply remains close to normal, that of industrialists reporting difficulties of demand only remains below its long-term average.
graphiqueGraphang2 – Production capacity utilisation rate

tableautableau1 – Industrialists' opinion: demand and production factors
| Manufacturing industry | Mean | Oct. 16 | Jan. 17 | April 17 | July 17 |
|---|---|---|---|---|---|
| Global demand | |||||
| Past change | 0 | 4 | 12 | 10 | 16 |
| Future change | 1 | 8 | 9 | 8 | 10 |
| Foreign demand | |||||
| Past change | 2 | 6 | 13 | 8 | 20 |
| Future change | 4 | 7 | 9 | 11 | 12 |
| Production factors | |||||
| Production bottlenecks (in %) | 22 | 27 | 29 | 29 | 31 |
| Assessment of productive capacity | 14 | 11 | 9 | 4 | 3 |
| Production capacity utilisation rate (in %) | 82.9 | 83.0 | 84.0 | 83.9 | 84.3 |
| Difficulties of supply and demand (in %) | |||||
| Difficulties of supply and demand | 8 | 10 | 9 | 7 | 8 |
| Difficulties of supply only | 20 | 18 | 20 | 21 | 22 |
| Difficulties of demand only | 43 | 36 | 34 | 32 | 31 |
- * : Long-term average since 1976, except for questions on difficulties of supply and demand.
- The results of the last survey are preliminary.
- Source: INSEE - Quarterly business survey in industry
A few less industrialists than in April forecast job cuts
In July 2017, almost as industrialists as in April have reported that they reduced workforce in the past three months. Nevertheless, they are less to forecast job cuts in the next months. Both balances have been above their long-term average since October 2013.
Two out of five industrialists have experienced hiring difficulties; this part has significantly increased in July and has reached its highest level since July 2008, above its long-term average.
graphiqueGraphang3 – Workforce size in the manufacturing industry

Virtual stabilisation in past selling prices
According to industrialists, selling prices in the manufacturing industry have barely increased in Q2 2017 (+0.2%). Business managers forecast a further small increase in Q3 2017 (+0.2%).
Only 10% of the industrialists have experienced cash-flow problems, a level virtually stable since April 2013, below its mean level (14%).
General exportation expectations have taken off
In July 2017, industrialists are much more upbeat than in April on general exportation expectations: the balance of opinion has bounced back to its highest level since October 2000, significantly above normal. The industrialists' opinion on their competitive position is almost unchanged on domestic market, stable on foreign markets inside EU but has faltered regarding outside EU markets. These three balances remains above their long-term average.
graphiqueGraphang4 – Competitive position

tableautableau2 – Industrialists' opinion: employment, competitive position, cash-flow and selling prices
| Manufacturing industry | Mean | Oct. 16 | Jan. 17 | April 17 | July 17 |
|---|---|---|---|---|---|
| Workforce size | |||||
| Past change | –11 | –5 | –3 | –2 | –1 |
| Expected change | –12 | –2 | –4 | –3 | –1 |
| Difficulties hiring (in %) | 28 | 34 | 27 | 31 | 39 |
| Selling prices and cash-flow | |||||
| Past change on selling prices | 0.1 | –0.1 | 0.3 | 0.4 | 0.2 |
| Expected change on selling prices | 0.2 | 0.3 | 0.2 | 0.1 | 0.2 |
| Cash-flow problems (in %) | 14 | 11 | 11 | 10 | 10 |
| Competitive position | |||||
| On domestic market | 1 | 1 | 1 | 3 | 2 |
| On foreign markets inside EU | –1 | 0 | 1 | 5 | 5 |
| On foreign markets outside EU | –2 | –2 | 3 | 4 | 1 |
| General exportation expectations | –9 | –1 | 3 | –4 | 14 |
- * : Long-term average since 1976, except for workforce change (since 1976) and for competitive position by market (since 1997).
- The results of the last survey are preliminary.
- A quantitative question is asked about selling prices.
- Source: INSEE - Quarterly business survey in industry
Documentation
Abbreviated methodology (pdf,174 Ko)
Pour en savoir plus
Time series : Industry
