


 22 June 2017
2017- n° 165In June 2017, the economic climate improves again in the building construction industry Monthly survey of building - June 2017
22 June 2017
2017- n° 165In June 2017, the economic climate improves again in the building construction industry Monthly survey of building - June 2017
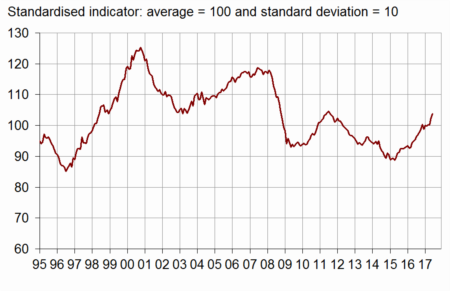
According to the business managers in the building construction industry surveyed in June 2017, the business climate has improved again. After having increased by three points in May, the composite indicator has increased by one point and stands at 104, a level unseen since August 2011 and above its long term average (100). Almost all balances of opinion have reached or exceeded their long-term average.

Warning: in the survey of June 2017, the seasonal coefficients have been updated as well as the parameters of the composite indicator. As a result, the set of results previously published in this survey is subject to slight revisions.
According to the business managers in the building construction industry surveyed in June 2017, the business climate has improved again. After having increased by three points in May, the composite indicator has increased by one point and stands at 104, a level unseen since August 2011 and above its long term average (100). Almost all balances of opinion have reached or exceeded their long-term average.
graphiqueGraph1 – Business climate composite indicator
The turning point indicator remains in the favourable outlook zone.
graphiqueGraph2 – Turning-point indicator
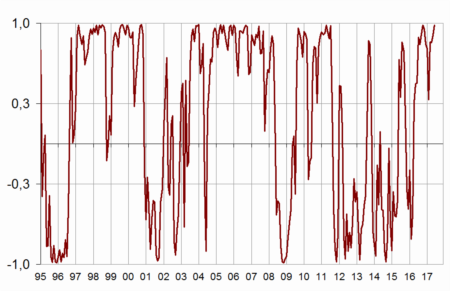
- Note: close to 1 (respectively −1), it indicates a favourable climate (respectively unfavourable). Between +0.3 and −0.3: uncertainty area
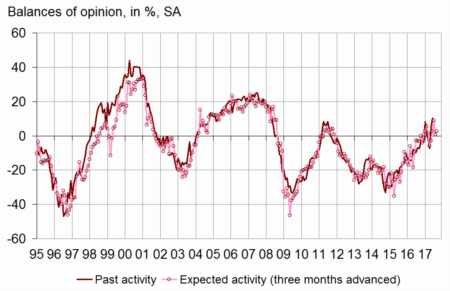
Business managers' opinion on their past activity has improved again
In June 2017, more business managers than in May have indicated an increase in their past activity. The corresponding balance stands well above its long-term average and at its highest level since April 2008. Moreover, the balance of opinion on expected activity has recovered slightly. It stands far above its long-term average as well.
graphiqueGraph3 – Activity tendency in building construction
tableauTable1 – Building industry economic outlook
| Mean* | March 17 | April 17 | May 17 | June 17 | |
|---|---|---|---|---|---|
| Composite indicator | 100 | 100 | 100 | 103 | 104 |
| Past activity | –4 | –2 | –8 | 5 | 10 |
| Expected activity | –6 | 3 | 9 | 1 | 3 |
| Gen. business outlook | –18 | 6 | |||
| Past employment | –6 | –12 | –15 | –6 | –6 |
| Expected employment | –5 | –7 | –5 | –1 | 3 |
| Opinion on order books | –24 | –35 | –30 | –28 | –24 |
| Order books (in month) | 5.5 | 7.0 | 6.8 | 7.1 | 7.2 |
| Production capacity utilisation rate | 88.4 | 87.3 | 87.7 | 87.8 | 88.1 |
| Obstacles to production increase (in %) | 32 | 27 | 29 | 29 | 31 |
| - Because of workforce shortage (in %) | 13.8 | 5.9 | 6.6 | 7.3 | 7.7 |
| Recruiting problems (in %) | 57 | 51 | |||
| Expected prices | –15 | –13 | –13 | –16 | –13 |
| Cash-flow position | –10 | –10 | |||
| Repayment period | 30 | 30 |
- * Mean since April 1975 for the composite indicator and since September 1993 for the balances of opinion.
- Source: INSEE, French business survey in the building industry
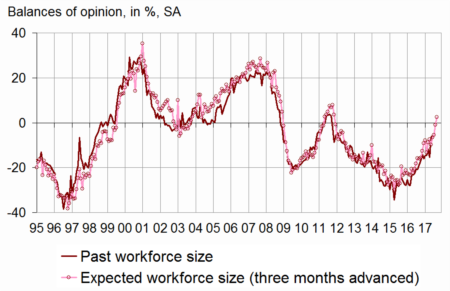
More business managers plan to increase their staff size
In June 2017, as many business managers as in May have indicated an increase in their staff size over the last three months. The corresponding balance stands at its long-term average. The balance of opinion on expected employment has kept improving since March 2017. It has risen again in June 2017 and now stands well above its long-term average.
graphiqueGraph4 – Workforce size tendency in building construction
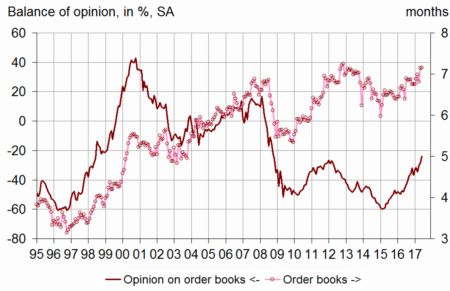
Order books fill up
In June 2017, more business managers than in May consider that their order books are well filled for the period. The corresponding balance of opinion has picked up regularly for two years and has joined its long-term average for the first time since October 2008. With their present staff size, business managers consider that their order books provide 7.2 months of work, a slightly higher level than last month and clearly higher than its long-term average (5.5 months).
graphiqueGraph5 – Order books
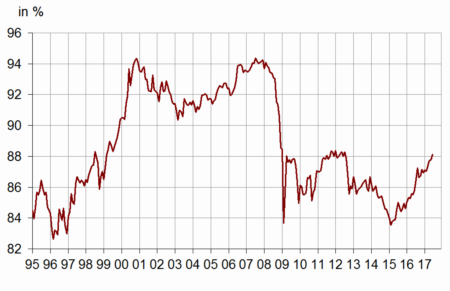
Production capacity is more used
After having weakly hovered around 87% between August 2016 and February 2017, the production capacity utilisation rate has risen again since March. In June 2017, it has increased again and reached 88.1%. However, it remains slightly below its long-term average (88.4%). 31% of business managers have reported production bottlenecks, a share unseen since June 2009 and a shade below its long-term average.
graphiqueGraph6 – Production capacity utilisation rate
More business managers plan to increase their prices
In June 2017, more business managers than in May have indicated that they will increase their prices in the next three months. The corresponding balance has exceeded its long term-average and has returned to the level hit at the beginning of the year, its highest since July 2011.
Documentation
Abbreviated methodology (pdf,177 Ko)
Pour en savoir plus
