


 22 June 2017
2017- n° 166In June 2017, the business climate in services is stable above its long-term average Monthly survey of services - June 2017
22 June 2017
2017- n° 166In June 2017, the business climate in services is stable above its long-term average Monthly survey of services - June 2017
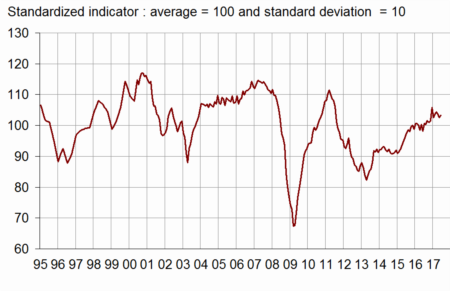
According to business managers surveyed in June 2017, the business climate in services remains favourable. The business climate composite indicator is stable at 103, above its long-term average (100).
- Business and demand prospects have improved, but those on employment are less favourable
- The business climate has improved again in road transport
- In accommodation and food services, the business climate has improved
- The business climate remains just below its long-term average in information and communication
- The business climate has improved in real estate activities
- In professional, scientific and technical activities, the business climate is virtually stable
- The business climate has decreased in administrative and support service activities
According to business managers surveyed in June 2017, the business climate in services remains favourable. The business climate composite indicator is stable at 103, above its long-term average (100).
graphiqueGraph1 – Business climate composite indicator
The turning point indicator has returned in the area indicating a favourable short-term economic.
graphiqueGraph2 – Turning point indicator
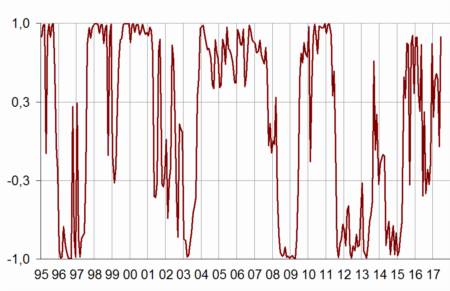
- Note: close to 1 (respectively −1), this indicator indicates a favourable short-term economic situation (respectively unfavourable). Between +0.3 and −0.3: uncertainty area.
Business and demand prospects have improved, but those on employment are less favourable
The balance on general outlook, which relates the assessment of business leaders over their whole sector, is stable, clearly above its long-term average. The balance on past activity is also unchanged, at its average. However, the personal expectations on activity and demand have improved ; the corresponding balances stand close to their long-term average.
The balance on past employment is unchanged, far above its long-term average. However, that on expected employment has gone down because of temporary work agencies, returning close to its long-term average.
The balances on past and expected investments have decreased. Nevertheless, both balances stand above their long-term average.
tableauTable1 – Economic outlook in the services sector
| Average* | March 17 | April 17 | May 17 | June 17 | |
|---|---|---|---|---|---|
| Composite indicator | 100 | 104 | 104 | 103 | 103 |
| General outlook | –8 | –2 | –1 | 0 | 0 |
| Past activity | 2 | 8 | 6 | 2 | 2 |
| Expected activity | 2 | 2 | 0 | –1 | 1 |
| Expected demand | –1 | 0 | 1 | –2 | 0 |
| Past selling prices | –4 | –5 | –8 | –7 | –6 |
| Expected selling prices | –3 | –2 | –5 | –6 | –4 |
| Past employment | 3 | 14 | 13 | 13 | 13 |
| except temporary work agencies | 1 | 6 | 4 | 5 | 5 |
| Expected employment | 2 | 13 | 12 | 10 | 4 |
| except temporary work agencies | –1 | 3 | 4 | 3 | 3 |
| Investments | |||||
| Past investments | 2 | 8 | 10 | 7 | 4 |
| Expected investments | 1 | 7 | 0 | 8 | 4 |
- * Average since 1989 for the composite indicator and since 1988 for the balances of opinion
- Source: INSEE, monthly business survey in services.
In the two major subsectors (information and communication, and professional, scientific and technical activities), the business climate is virtually stable. It has lost two points in administrative and support activities, and has gone up in other subsectors. All business climate composite indicators stand above their long-term average, except that in information and communication, which stands just below it (99).
The business climate has improved again in road transport
In road transport, the business climate has increased by two points. At 111, it stands at its highest level since March 2008. The balances on activity and demand have gone up markedly, whereas those on past employment and general outlook have decreased while remaining clearly above their long-term average.
In accommodation and food services, the business climate has improved
In accommodation and food services, the business climate has increased by three points, to 105. All balances stand above their long-term average. Those on past activity and general outlook have increased significantly. Other balances are virtually stable.
The business climate remains just below its long-term average in information and communication
In information and communication, the business climate is virtually stable, slightly below its long-term average (99). The balances on expected activity and demand have gone up but remain clearly below their long-term average.
The business climate has improved in real estate activities
In real estate activities, the business climate has increased by two points, to 105. The balances on activity and demand have improved. However, that on expected employment has gone down, returning below its long-term average.
In professional, scientific and technical activities, the business climate is virtually stable
The business climate in professional, scientific and technical activities is virtually stable. At 104, it stands above its long-term average. The balances on past activity, past employment and general outlook have increased.
The business climate has decreased in administrative and support service activities
In administrative and support service activities, the business climate indicator has decreased by two points. At 105, it remains above its long-term average. Almost all balances stand above their long-term average, except that on expected employment which has fallen back slightly below its long-term average, because of temporary work agencies.
tableauTable2 – Business climate composite indicator and balances of opinion by sub-sector in services
| Aggregated classification (NA 2008) at level A21 | Mean* | March 17 | April 17 | May 17 | June 17 |
|---|---|---|---|---|---|
| Road transport (8%) | |||||
| Composite indicator | 100 | 108 | 105 | 109 | 111 |
| Past activity | –8 | 4 | 1 | –11 | 3 |
| Expected activity | –9 | –1 | –5 | 5 | 10 |
| Expected demand | –12 | 1 | –4 | 1 | 6 |
| Past employment | –7 | 11 | 8 | 9 | 7 |
| Expected employment | –9 | 3 | 3 | 6 | 7 |
| General outlook | –22 | –6 | –8 | 0 | –3 |
| Accommodation and food service activities (11%) | |||||
| Composite indicator | 100 | 98 | 107 | 102 | 105 |
| Past activity | –7 | 2 | –6 | –7 | –2 |
| Expected activity | –7 | –14 | –4 | –4 | –3 |
| Expected demand | –10 | –14 | 0 | –7 | –8 |
| Past employment | –4 | –4 | –3 | –1 | –2 |
| Expected employment | –6 | –4 | –7 | –7 | –5 |
| General outlook | –14 | –14 | –3 | –15 | –6 |
| Information and communication (24%) | |||||
| Composite indicator | 100 | 101 | 99 | 98 | 99 |
| Past activity | 8 | 10 | 3 | –5 | –6 |
| Expected activity | 9 | 3 | –6 | –14 | –6 |
| Expected demand | 10 | –3 | –3 | –7 | –2 |
| Past employment | 6 | 9 | 9 | 5 | 8 |
| Expected employment | 10 | 14 | 14 | 15 | 11 |
| General outlook | 0 | 1 | –1 | 2 | 4 |
| Real estate activities (13%) | |||||
| Composite indicator | 100 | 102 | 103 | 103 | 105 |
| Past activity | 7 | 6 | 8 | 8 | 12 |
| Expected activity | 8 | 11 | 9 | 11 | 12 |
| Expected demand | 1 | 3 | 4 | 3 | 6 |
| Past employment | 3 | 6 | 5 | 4 | 5 |
| Expected employment | 2 | 4 | 8 | 4 | –1 |
| General outlook | –2 | 2 | 2 | 5 | 5 |
| Professional, scientific and technical activities (24%) | |||||
| Composite indicator | 100 | 104 | 104 | 103 | 104 |
| Past activity | –1 | 4 | 4 | 3 | 5 |
| Expected activity | –2 | –1 | –2 | –3 | –4 |
| Expected demand | –6 | 0 | 1 | –1 | –3 |
| Past employment | 1 | 8 | 6 | 7 | 9 |
| Expected employment | 0 | 6 | 6 | 9 | 9 |
| General outlook | –9 | –4 | –3 | –4 | –1 |
| Administrative and support service activities (18%) | |||||
| Composite indicator | 100 | 110 | 108 | 107 | 105 |
| Past activity | 6 | 18 | 20 | 14 | 13 |
| Expected activity | 5 | 16 | 12 | 12 | 7 |
| Expected demand | 3 | 13 | 9 | 9 | 8 |
| Past employment | 9 | 30 | 33 | 32 | 27 |
| Expected employment | 7 | 30 | 28 | 20 | 4 |
| General outlook | –5 | 4 | 6 | 6 | 4 |
- The figures in parentheses indicate the weights used to aggregate the sub-sector balances of opinion.
- *Composite indicators: average since 1989 (2006 for road transport); balances of opinion : average since 1988 (2006 for road transport)
- Source : INSEE, monthly business survey in services.
Documentation
Abbreviated Methodology (2017) (pdf,177 Ko)
Pour en savoir plus
Time series : Economic outlook surveys – Services
