


 31 May 2017
2017- n° 149In March 2017, services output bounced back (+1.0%) Index of services production - March 2017
31 May 2017
2017- n° 149In March 2017, services output bounced back (+1.0%) Index of services production - March 2017
In March 2017, output recovered in services (+1.0%) after a drop in February (−0.5%).

The commentary shows variations of subsections by decreasing contribution to the overall variation. The contribution of a subsection depends on the extent of the change and on its weight.
In March 2017, output recovered in services (+1.0%) after a drop in February (−0.5%).
Services output rose markedly over the last three months
Over the first quarter of 2017, services production increased by 1.4% compared to the last quarter of 2016.
It grew by 1.2% in business support activities, in particular in specialised, scientific and technical activities (+2.0%). It rose sharply in information and communication (+1.8%), accomodation and food services activities (+2.4%) and household services (+2.6%). It also increased in transportation and storage (+1.0%). It was stable in real estate activities.
Output grew sharply over a year
In services, output of the last three months rose sharply over a year (+3.3%), with an increase in all sectors.
It went up strongly in business support (+4.4%), be it in administrative and business service activities (+5.1%) or in specialised, scientific and technical activities (+3.8%). It grew sharply in information and communication (+3.1%), real estate activities (+3.3%), and food and beverage services activities (+3.6%). It increased more moderately in transportation and storage (+1.6%) and in household services (+0.8%).
graphiqueGraph1 – Index of services production
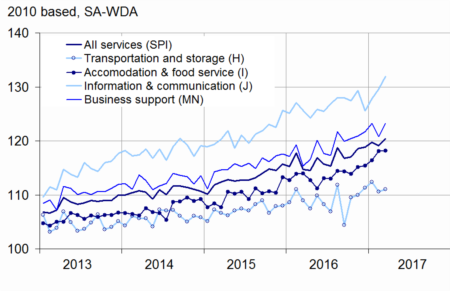
- Sources: DGFiP, INSEE
tableauTable1 – Variation in the services production
| Change in % | |||||
|---|---|---|---|---|---|
| Nace classification | Weight * | March/ Feb. | Feb./ Jan. | q-o-q (1) | y-o-y (2) |
| Index of services production | 10000 | 1.0 | −0.5 | 1.4 | 3.3 |
| H Transportation and storage | 1601 | 0.4 | −1.5 | 1.0 | 1.6 |
| I Accomodation and food service activities | 926 | 0.0 | 1.5 | 2.4 | 3.6 |
| J Information and communication | 1745 | 1.8 | 1.4 | 1.8 | 3.1 |
| L Real estate activities | 1064 | −0.2 | −0.4 | 0.0 | 3.3 |
| M+N Business support | 4020 | 2.0 | −2.0 | 1.2 | 4.4 |
| M Specialised, scientific and technical activities | 2210 | 2.3 | −2.5 | 2.0 | 3.8 |
| N Administrative and business service activities | 1810 | 1.7 | −1.3 | 0.2 | 5.1 |
| R+S Household services | 644 | −3.0 | 2.2 | 2.6 | 0.8 |
- *Weight (10 000 = H…S excepting K, O, P, Q)
- (1) Quarter-on-quarter: last three months / previous three months
- (2) Year-on-year: last three months / same three months of previous year
- Upturn in business support
- Sources: DGFiP, INSEE
In March 2017, output in business support activities bounced back sharply (+2.0% after −2.0% in February).
It recovered significantly in specialised, scientific and technical activities (+2.3% after −2.5%), particularly in architecture and engineering activities (+3.3%), scientific research and development (+4.9%), activities of head offices and management consultancy (+1.7%) and legal and accounting activities (+2.3%).
Output bounced back also in administrative and business support activities (+1.7% after −1.3%), notably in rental and leasing activities (+2.3%), other administrative and business support activities (+2.8%) and employment activities (+1.1%).
Further rise in information and communication
In March, output in information and communication went up sharply again (+1.8% after +1.4%), held up by a significant rise in computer programming, consultancy and related activities (+4.5%).
Marked drop in household services
Output in household services fell back sharply in March (−3.0%) after a marked increase in February (+2.2%). It sank notably in arts, entertainment and recreation (−5.1%).
Slight rebound in transportation and storage
In March, output in transportation and storage recovered slightly (+0.4% after −1.5%). It bounced back in warehousing and support for transportation (+3.4% after −3.7%) and in land transport (+1.1% after −0.9%). By contrast, it slipped back steeply in water transport (−17.2% after +16.4%).
Stability in accomodation and food service activities
In March, output was stable in accomodation and food services after +1.5% in February. It was virtually stable both in food and beverage service activities and accomodation.
Revisions
The month-on-month variation rate of the index of services production in February 2017 has been revised upwards by 0.2 points, mainly due to raw series updating. Initially published at −0.7%, it has been stated at −0.5%.
tableauTable2 – Variation in the services production
| Changes in % | |||||
|---|---|---|---|---|---|
| Weight * | March 17 | March/ Feb. | Feb./ Jan. | q-o-q (1) | |
| Index of services production | 10000 | 120.3 | 1.0 | −0.5 | 1.4 |
| H transportation and storage | 1601 | 111.0 | 0.4 | −1.5 | 1.0 |
| 49 Land transport… | 686 | 116.8 | 1.1 | −0.9 | 2.1 |
| 50 Water transport | 63 | 169.0 | −17.2 | 16.4 | 3.8 |
| 51 Air transport | 129 | 94.6 | 0.7 | −8.2 | −2.4 |
| 52 Warehousing and support for transportation | 563 | 111.5 | 3.4 | −3.7 | 0.4 |
| 53 Postal and courier activities | 161 | 74.9 | −1.1 | −3.7 | −1.9 |
| I Accomodation and food service activities | 926 | 118.2 | 0.0 | 1.5 | 2.4 |
| 55 Accomodation | 211 | 110.2 | −0.1 | 1.4 | 3.6 |
| 56 Food and beverage service activities | 715 | 120.6 | 0.1 | 1.5 | 2.1 |
| J Information-communication | 1745 | 131.9 | 1.8 | 1.4 | 1.8 |
| 58 Publishing activities | 220 | 102.2 | 2.1 | 1.3 | 0.0 |
| 59 Motion picture, sound recording, music publishing | 124 | 116.2 | −0.6 | 3.6 | 1.2 |
| 60 Programming and broadcasting activities | 68 | 126.2 | 2.5 | −3.2 | 0.1 |
| 61 Telecommunications | 558 | 135.6 | −0.8 | 2.6 | 2.1 |
| 62 Computer programming... | 683 | 139.7 | 4.5 | 0.3 | 2.2 |
| 63 Information services | 92 | 148.5 | −0.2 | 3.7 | 2.8 |
| L Real estate activities | 1064 | 106.4 | −0.2 | −0.4 | 0.0 |
| M Specialised, scientific and technical activities | 2210 | 120.4 | 2.3 | −2.5 | 2.0 |
| 69 Legal and accounting activities | 496 | 120.6 | 2.3 | −1.6 | 2.8 |
| 70 Activities of head offices and management consultancy | 665 | 119.9 | 1.7 | −4.5 | 0.2 |
| 71 Architecture and engineering activities | 465 | 125.6 | 3.3 | −3.6 | 5.3 |
| 72 Scientific research and development | 313 | 104.2 | 4.9 | −2.9 | 0.6 |
| 73 Advertising and market research | 171 | 112.5 | 0.6 | −2.3 | 0.4 |
| 74 Other professional, scientific and technical activities | 71 | 176.7 | −2.3 | 12.1 | 2.2 |
| 75 Veterinary activities | 29 | 127.0 | 1.1 | 0.8 | 0.2 |
| N Administrative and business service activities | 1810 | 126.8 | 1.7 | −1.3 | 0.2 |
| 77 Rental and leasing activities | 545 | 123.5 | 2.3 | −1.6 | −2.5 |
| 78 Employment activities | 512 | 132.8 | 1.1 | −1.5 | 3.3 |
| 79 Travel agency, tour operator | 45 | 110.6 | −3.0 | −0.6 | 0.7 |
| 80 Security and investigation | 109 | 125.2 | 1.0 | −0.4 | 0.3 |
| 81 Services to building and landscape anctivities | 248 | 122.4 | 1.5 | −0.6 | 0.7 |
| 82 Other administrative and business support activities | 351 | 128.6 | 2.8 | −1.4 | −0.4 |
| R Arts, entertainment and recreation | 306 | 128.2 | −5.1 | 3.9 | 3.7 |
| S Other personal services | 338 | 112.1 | −0.7 | 0.4 | 1.4 |
- *Weight (10 000 = H…S excepting K, O, P, Q)
- (1) Quarter-on-quarter: last three months / previous three months
- Sources: DGFiP, INSEE
tableauTable3 – Revision of variations
| Feb. / Jan. | Jan. / Dec. | Dec. / Nov. | Q4 2016 / Q3 2016 | 2016 / 2015 | |
|---|---|---|---|---|---|
| Services production | 0.21 | −0.25 | 0.39 | −0.04 | 0.07 |
| Raw series | 0.38 | −0.15 | 0.04 | −0.01 | −0.01 |
| SA-WDA parameters | −0.17 | −0.10 | 0.35 | −0.03 | 0.08 |
- How to read: in the services industries, the SA-WDA variation in output between January 2017 and February 2017 is revised by +0.21 points: +0,38 points due to the revisions of raw data and −0,17 points due the update of SA-WDA parameters
- Sources: DGFiP, INSEE
Documentation
Pour en savoir plus
