


 31 May 2017
2017- n° 151In April 2017, agricultural product prices kept increasing sharply over one year (+6.4%) Indices of agricultural prices - April 2017
31 May 2017
2017- n° 151In April 2017, agricultural product prices kept increasing sharply over one year (+6.4%) Indices of agricultural prices - April 2017
In April 2017, agricultural product prices rose by 6.4% over one year, after +6.2 % in March. Excluding vegetables and fruits, they decreased by 0.3% over one month and went up by 7.1% over one year.
In April 2017, agricultural product prices rose by 6.4% over one year, after +6.2 % in March. Excluding vegetables and fruits, they decreased by 0.3% over one month and went up by 7.1% over one year.
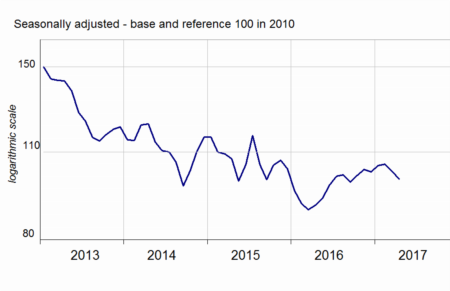
Drop in cereal and oilseed prices
In April 2017, cereal prices declined again (−2.7%, after −2.6% in March). The ample global supply weighed on prices. Similarly, oilseed prices continued to drop (−3.2% after −2.9%). Rape price, the main oilseed grown in France, followed the fall in soy and palm oil prices, which rape can be used as a substitute for. Forecasts have showed a record soy crop this year, while demand was sluggish for palm oil.
graphiqueGraph1 – Producer prices of cereals
- Source: INSEE
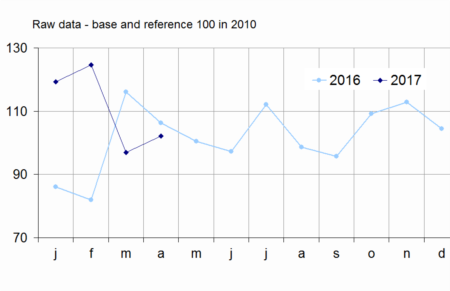
Decline in fresh vegetable prices but fresh fruit and potato prices became higher
In April 2017, fresh vegetable prices decreased over one year (−3.8%). Demand barely kept up with the abundant supply of lettuces and caulyflowers boosted by good weather conditions. Conversely, tomato price remained high in this period of the year: the greenhouse production started lower than last year. Fresh fruit prices remained dynamic over one year (+4,9%). Because of the weak yields in North-Western Europe during the last production campaign, potato prices remained higher than a year ago (+26.7%). Wine prices declined by 0.6% over one year reflecting the fall (−9.0%) in prices of wines without protected designation of origin (“other wines”), which underwent Spanish competition.
graphiqueGraph2 – Producer prices of fresh vegetables
- Source: SSP (ministry in charge of agriculture)
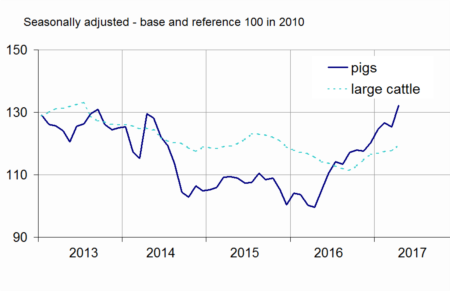
Rise in animals and milk prices
Over one year, animal prices accelerated (+7.5% in April after +4.3% in March) reflecting the stronger rise in pig price (+32.6% after +25.1% in March). Pig demand remained buoyant, still noticeably from China.
graphiqueGraph3 – Producer prices of pigs and large cattle
- Source: INSEE
Cow milk price rose again (+2.6% from January to March) : global milk collection has been decreasing since mid-2016 while butter and cheese exportations were dynamic, mainly towards the United States and Asia.
tableauTableau1 – Indice of producer prices of agricultural products (IPPAP)
| Variation as % over | |||||
|---|---|---|---|---|---|
| Weights | April2017 | a month | 3 months | a year | |
| Agricultural goods output | 1000 | 117.3 | /// | /// | +6.4 |
| excluding fruits and vegetables | 900 | 118.5 | –0.3 | –0.4 | +7.1 |
| Crop output (excluding fruits and vegetables) | 505 | 120.8 | –1.4 | –2.3 | +5.9 |
| Cereals | 188 | 99.8 | –2.7 | –4.8 | +10.2 |
| of which soft wheat | 112 | 96.7 | –4.1 | –6.1 | +13.5 |
| grain maize | 41 | 101.4 | –0.7 | –0.4 | +10.7 |
| Potatoes | 26 | 247.0 | /// | /// | +26.7 |
| Wines | 177 | 132.7 | –0.5 | –0.3 | –0.6 |
| protected designation of origin | 84 | 143.9 | –0.4 | +0.1 | +1.1 |
| other wines | 23 | 132.7 | –1.8 | –2.6 | –9.0 |
| Oleaginous | 49 | 104.4 | –3.2 | –5.4 | +7.3 |
| Horticultural products | 30 | 111.1 | +3.3 | –0.2 | +0.6 |
| Other crop products | 36 | 111.4 | –0.4 | –0.3 | +2.6 |
| Fruits and vegetables (1) | 100 | 106.5 | /// | /// | –0.6 |
| Fresh vegetables | 53 | 102.2 | /// | /// | –3.8 |
| Fresh fruits | 35 | 111.0 | /// | /// | +4.9 |
| Animal output | 395 | 115.6 | +1.2 | +2.4 | +9.0 |
| Animals | 234 | 118.4 | +2.0 | +2.2 | +7.5 |
| of which large cattle | 96 | 119.6 | +1.7 | +2.4 | +3.4 |
| calves | 26 | 108.2 | –1.4 | –1.6 | –1.6 |
| pigs | 54 | 132.2 | +5.4 | +6.2 | +32.6 |
| sheep | 10 | 110.9 | +5.4 | +1.3 | –1.4 |
| poultry | 46 | 107.9 | –0.6 | –1.0 | –2.3 |
| of which chicken | 28 | 107.1 | –0.9 | –1.6 | –2.7 |
| Milk | 147 | 108.5 | /// | +2.3 | +9.2 |
| of which cow milk (2) | 137 | 108.3 | /// | +2.6 | +9.8 |
| Eggs | 15 | 143.1 | +0.7 | +5.5 | +31.5 |
- * Except for fresh fruits, fresh vegetables and potatoes
- /// Absence of result due to the nature of these series
- (1) Including vegetables for industry.
- (2)The March value of cow milk price indice has been carried forward in April.
- Sources: INSEE, SSP (ministry in charge of agriculture)
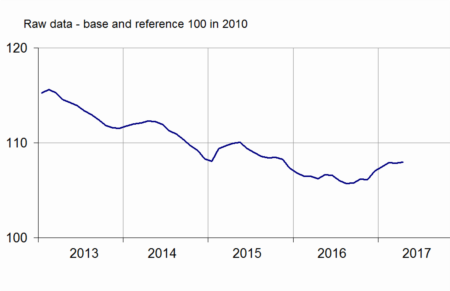
Purchase prices of means of production were virtually stable In April
In April 2017, intermediate consumption prices increased by 0.2% over the month and by 1.6 % yoy, mainly due to higher energy prices (+0.9% in April, +15.5% yoy). On the other hand, fertilisers prices kept on going down (−0.2% in April ; −5,2% over one year). Capital goods prices were stable over the month and increased by 1.8% over a year.
Revisions
The variation over one year of IPPAP has been raised by 0.3 points in March and that of IPAMPA by 0.1 points over one month and over one year alike.
graphiqueGraph4 – Purchase prices of the means of agricultural production
- Sources: INSEE, SSP (ministry in charge of agriculture)
tableauTableau2 – Indices of purchase prices of the means of agricultural production (IPAMPA)
| variation as % over | |||||
|---|---|---|---|---|---|
| Weights | April 2017 | a month | 3 months | a year | |
| Total input | 1000 | 108.0 | +0.1 | +0.6 | +1.7 |
| Intermediate consumptions | 764 | 107.9 | +0.2 | +0.5 | +1.6 |
| Energy | 100 | 101.1 | +0.9 | –1.1 | +15.5 |
| Seeds | 57 | 106.5 | +0.1 | +0.2 | –1.8 |
| Fertilisers and soil improvers | 92 | 105.9 | –0.2 | +1.9 | –5.2 |
| Plant protection products | 78 | 98.3 | +0.4 | +0.6 | –0.6 |
| Animal feed | 205 | 113.7 | –0.1 | +0.9 | +2.0 |
| Veterinary expenses | 43 | 119.4 | +0.1 | +0.3 | +1.9 |
| Small equipment and tools | 17 | 106.9 | +0.2 | –1.1 | –1.0 |
| Maintenance of materials | 67 | 115.2 | +0.2 | +0.5 | +1.8 |
| Maintenance of buildings | 9 | 108.2 | 0.0 | +0.1 | +2.1 |
| Other goods and services | 97 | 102.8 | +0.1 | +0.2 | –0.4 |
| Goods and services contributing to investment | 236 | 108.3 | 0.0 | +0.6 | +1.8 |
| Material | 186 | 109.4 | 0.0 | +0.6 | +1.4 |
| Tractors | 79 | 110.0 | –0.3 | +0.7 | +1.9 |
| Machinery and equipment for cultivation | 36 | 111.2 | 0.0 | +0.9 | +1.2 |
| Machinery and equipment for harvesting | 42 | 109.6 | +0.2 | –0.2 | +1.3 |
| Utility vehicles | 18 | 104.6 | +0.3 | +0.6 | +0.5 |
| Buildings | 50 | 104.4 | 0.0 | +0.8 | +3.4 |
- (1) The repayment of the domestic tax on energy product (TICPE) benefiting farmers has been applied in advance for the year 2017
- Sources: INSEE, SSP (ministry in charge of agriculture)
Documentation
Methodology (pdf,122 Ko)
Pour en savoir plus
Time series : Indices of agricultural prices
