


 23 May 2017
2017- n° 134In May 2017, the economic climate improves again in the building construction industry Monthly survey of building - May 2017
23 May 2017
2017- n° 134In May 2017, the economic climate improves again in the building construction industry Monthly survey of building - May 2017
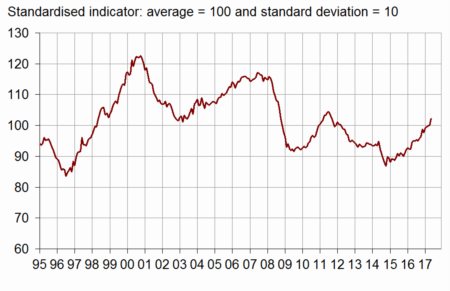
According to the business managers in the building construction industry surveyed in May 2017, the business climate has improved again. After three months of stability, the composite indicator has increased by two points and has exceeded its long term average (100) for the first time since March 2012.
According to the business managers in the building construction industry surveyed in May 2017, the business climate has improved again. After three months of stability, the composite indicator has increased by two points and has exceeded its long term average (100) for the first time since March 2012.
graphiqueGraph1 – Business climate composite indicator
The turning point indicator remains in the favourable outlook zone.
graphiqueGraph2 – Turning-point indicator
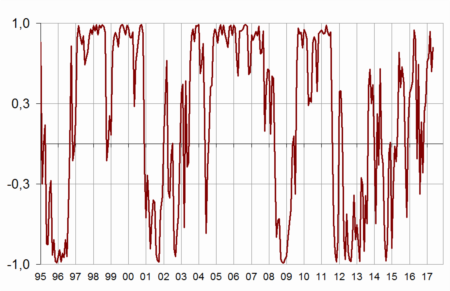
- Note: close to 1 (respectively −1), it indicates a favourable climate (respectively unfavourable). Between +0.3 and −0.3: uncertainty area
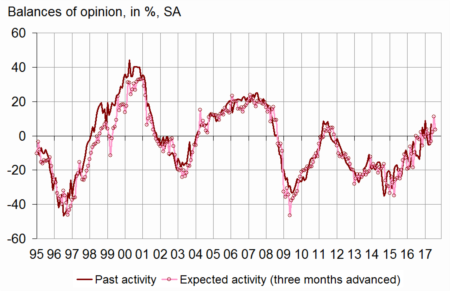
Business managers' opinion on their past activity has improved sharply
In May 2017, many more business managers than in April have indicated an increase in their past activity. The corresponding balance has returned well above its long-term average. In contrast, the balance of opinion on expected activity has fallen back after having increased sharply in April. It remains however well above its long-term average.
graphiqueGraph3 – Activity tendency in building construction
tableauTable1 – Building industry economic outlook
| Mean* | Feb. 17 | March 17 | April 17 | May 17 | |
|---|---|---|---|---|---|
| Composite indicator | 100 | 100 | 100 | 100 | 102 |
| Past activity | –4 | 0 | –5 | –5 | 7 |
| Expected activity | –6 | –3 | 2 | 11 | 4 |
| Gen. business outlook | –18 | 6 | |||
| Past employment | –6 | –11 | –9 | –14 | –6 |
| Expected employment | –5 | –10 | –6 | –6 | 0 |
| Opinion on order books | –24 | –30 | –32 | –27 | –27 |
| Order books (in month) | 5.5 | 6.9 | 7.0 | 6.8 | 7.1 |
| Production capacity utilisation rate | 88.4 | 87.0 | 87.3 | 87.7 | 87.9 |
| Obstacles to production increase (in %) | 32 | 25 | 27 | 29 | 31 |
| - Because of workforce shortage (in %) | 13.8 | 5.2 | 5.9 | 6.6 | 7.4 |
| Recruiting problems (in %) | 57 | 51 | |||
| Expected prices | –15 | –14 | –13 | –13 | –16 |
| Cash-flow position | –10 | –10 | |||
| Repayment period | 30 | 30 |
- * Mean since September 1993.
- Source: INSEE, French business survey in the building industry
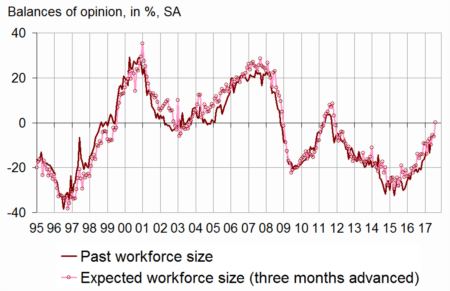
Many more business managers plan to enhance their staff size
In May 2017, far fewer business managers than in April have indicated a drop in their staff size over the last three months. The corresponding balance has reached its long-term average for the first time since February 2012. The balance of opinion on expected employment has also increased sharply and has overtaken its long-term average, hitting its highest level since August 2011.
graphiqueGraph4 – Workforce size tendency in building construction
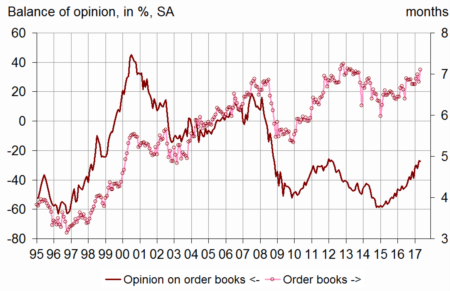
Order books remain less filled than on average
In May 2017, as many business managers as in April consider that their order books are poorly filled for the period. While it has improved regularly for two years, the corresponding balance of opinion remains below its long-term average. With their present staff size, business managers consider that their order books provide 7.1 months of work, a higher level than last month and than its long-term average (5.5 months).
graphiqueGraph5 – Order books
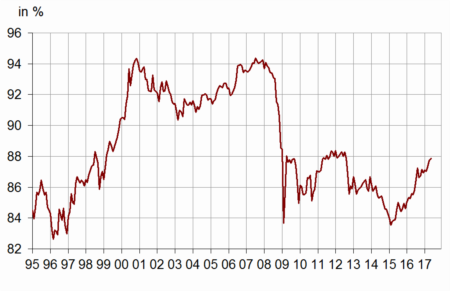
Production capacity is slightly more used
After having weakly hovered around 87% between August 2016 and February 2017, the production capacity utilisation rate has risen again since March. In May 2017, it has increased slightly, further to 87.9%. However, it has remained below its long-term average (88.4%) since January 2012. 31% of business managers have reported production bottlenecks, an share unseen since August 2009 and close to its long term average.
graphiqueGraph6 – Production capacity utilisation rate
Prices prospects close to normal
In May 2017, more business managers than in April have indicated that they will reduce their prices in the next three months. The corresponding balance has returned a shade below its long term-average.
Documentation
Abbreviated Methodology (2017) (pdf,176 Ko)
Pour en savoir plus
