


 18 May 2017
2017- n° 132In April 2017, oil prices fell back Prices of oil and raw material imports - April 2017
18 May 2017
2017- n° 132In April 2017, oil prices fell back Prices of oil and raw material imports - April 2017
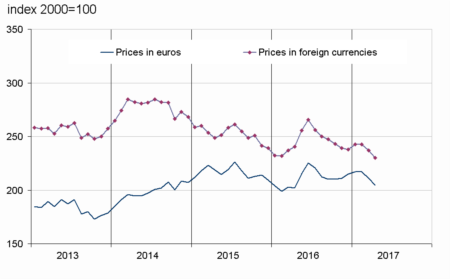
In April 2017, the price of crude oil in euros recovered (+1.9% after −6.7%). The prices in euros of all other imported commodities kept falling (−3.4% after −1.9%), both those of industrial raw materials (−3.6% after −1.4%) and those of raw food materials (−3.0% after −2.9%).

Erratum of 24 May 2017: this Informations Rapides replaces and supersedes the issue published on 18 May 2017 at 12:00 pm, as the figure for year-on-year change in price of crude oil in euros has been corrected in the second paragraph.
In April 2017, the price of crude oil in euros recovered (+1.9% after −6.7%). The prices in euros of all other imported commodities kept falling (−3.4% after −1.9%), both those of industrial raw materials (−3.6% after −1.4%) and those of raw food materials (−3.0% after −2.9%).
Oil price increased anew
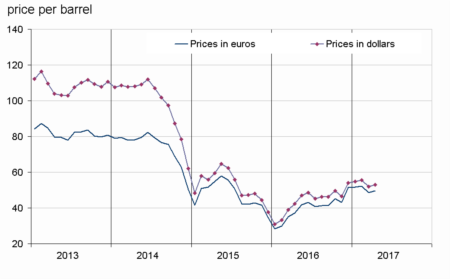
In April 2017, the price of North Sea crude oil (Brent) in euros increased anew (+1.9% after −6.7%). It reached an average of €49.5 per barrel, significantly higher than its April 2016 level (+32.9%). In dollars, the increase was a little more marked (+2.1% after −6.3%) because the euro appreciated again slightly during the month.
graphiqueGraph1 – Oil (Brent)
- Source : INSEE
tableauTable1 – Oil and petroleum products
| Prices | Change (%) | |||
|---|---|---|---|---|
| of last month | over the last month | over the last 3 months | over the last 12 months | |
| Brent in $ per barrel | 53.1 | 2.1 | –3.3 | 25.6 |
| Brent in € per barrel | 49.5 | 1.9 | –4.1 | 32.9 |
| Gasoline €/L | 0.401 | 8.7 | –0.8 | 19.8 |
| Gas Oil | 447.0 | 2.9 | –2.4 | 37.0 |
| Heavy fuel | 298.2 | –0.8 | –5.0 | 55.8 |
| Naphtha | 443.4 | 2.7 | –5.0 | 35.6 |
- Prices are in euros per tonne unless otherwise specified
- Source : INSEE
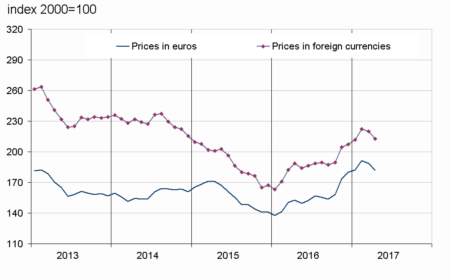
Industrial commodity prices continued to fall
The prices in euros of industrial raw materials declined more sharply in April 2017 (−3.6% after −1.4%). However, they remained far superior to their last year level (+19,1%). Over the month, minerals prices decreased clearly (−5.2% after −0.9%), particularly iron ore (−19.4% after −2.2%) that suffered from surplus supply. The prices of non-ferrous metals decreased again (−1.3% after −0.4%), in particular the price of nickel (−5.6% after −4.1%) affected by dwindling outlooks in stainless steel production, and the price of zinc (−5.8% after −2.8%). In contrast, the price of precious metals bounced back (+2.3% after −2.0%). The prices of agro-industrial raw materials recovered (+2.8% after −3.0%), primarly due to the price of sawn softwood that bounced back considerably (+12.6% after −4.6%). The price of tropical wood picked up more moderatly (+2.2% after −1.6%) and the price of wood pulp accelerated (+1.4% after +0.7%). However, the prices of natural fibers fell back (−0.4% after +2.0%), as well as hide one (−3.1% after +1.5%). The price of rubber kept tumbling (−15.5% after −11.3%).
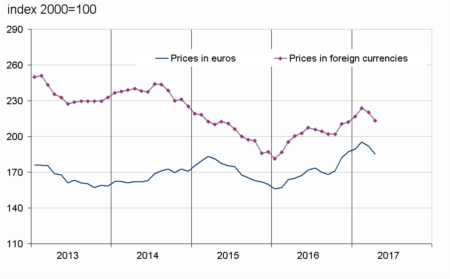
Food commodity prices decreased again
In euros, the prices of raw food materials decreased again (−3.0% after −2.9%). The prices of oil seeds and vegetable oils plummeted further (−4.3% after −4.2%) as well as those of tropical foodstuffs (−4.1% after −1.1%) and those of sugar (−9.8% after −11.9%) which were adversely affected by abundant supply. However, the price of cereals recovered (+0.8% after −1.3% ) and the price of beef meat increased again (+1.6% after +0.9%).
tableauTable2 – Imported raw materials (excluding energy) in euros
| Index | Changes (%) | |||
|---|---|---|---|---|
| of last month | over the last month | over the last 3 months | over the last 12 months | |
| Food total | 204.6 | –3.0 | –5.8 | 1.4 |
| Tropical foodstuffs | 178.6 | –4.1 | –9.3 | –10.1 |
| Oil seeds, vegetable oils | 229.5 | –4.3 | –7.9 | 3.9 |
| Cereals | 154.1 | 0.8 | –0.4 | 3.9 |
| Sugar | 170.5 | –9.8 | –21.2 | 15.1 |
| Beef meat | 164.0 | 1.6 | 9.0 | 8.7 |
| Industrial raw materials | 181.9 | –3.6 | –0.3 | 19.1 |
| Agricultural raw materials | 135.2 | 2.8 | 7.0 | 21.3 |
| Natural Fibres | 156.2 | –0.4 | 5.2 | 32.1 |
| Natural rubber | 165.2 | –15.5 | –23.4 | 4.7 |
| Hides | 80.1 | –3.1 | –1.3 | 8.5 |
| Wood pulp | 106.1 | 1.4 | 2.8 | 12.3 |
| Tropical wood | 98.3 | 2.2 | 1.6 | –6.5 |
| Sawn softwood | 136.3 | 12.6 | 29.9 | 43.6 |
| Minerals | 207.5 | –5.2 | –2.1 | 18.4 |
| Iron ore | 488.4 | –19.4 | –13.6 | 25.6 |
| Non-ferrous metals | 168.3 | –1.3 | 0.8 | 17.3 |
| Precious metals | 259.7 | 2.3 | 4.2 | 10.5 |
| All commodities | 185.3 | –3.4 | –2.3 | 12.3 |
- Source : INSEE
graphiqueGraph3 – Food
- Source : INSEE
graphiqueGraph2 – Imported raw materials (excluding energy)
- Source : INSEE
graphiqueGraph4 – Industrial raw materials
- Source : INSEE
Pour en savoir plus
Time series : Raw materials prices
