


 25 April 2017
2017- n° 105In April 2017, the business climate declines slightly in services Monthly survey of services - April 2017
25 April 2017
2017- n° 105In April 2017, the business climate declines slightly in services Monthly survey of services - April 2017
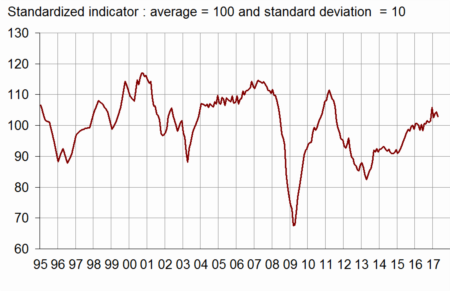
According to business managers surveyed in April 2017, the business climate in services has declined slightly. The composite indicator which measures it has decreased by one point and stands at 103, slightly above its long-term average (100).
- More pessimistic anticipations on activity and demand
- The business climate has decreased in road transport
- The business climate has improved markedly in accommodation and food service activities
- In information and communication, the business climate has returned just below its average
- The real estate business climate has declined
- The business climate is stable in professional, scientific and technical activities
- In administrative and support service activities, the business climate has decreased slightly
According to business managers surveyed in April 2017, the business climate in services has declined slightly. The composite indicator which measures it has decreased by one point and stands at 103, slightly above its long-term average (100).
graphiqueGraph1 – Business climate composite indicator
The turning point indicator has returned to the uncertainty area.
graphiqueGraph2 – Turning point indicator
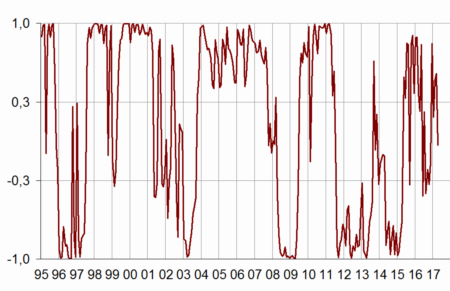
- Note: close to 1 (respectively −1), this indicator indicates a favourable short-term economic situation (respectively unfavourable). Between +0.3 and −0.3: uncertainty area.
More pessimistic anticipations on activity and demand
In April 2017, the balance of opinion on past activity is virtually stable, above its long-term average. However, fewer business leaders than in March expect an increase in activity and demand for the coming months.
The balance on expected activity has fallen back below its long-term average, the balance on expected demand has returned to it. Nevertheless, the balance of opinion on the general outlook is still well above its long-term average.
The balance of opinion on the operating balance on the last three months has decreased markedly since January 2017 and has fallen back below its long-term average. The balance on expected operating result is virtually stable, slightly below its long-term average.
The balance on past employment is unchanged, whereas that on expected employment has gone down slightly. Both balances stand clearly above their long-term average.
tableauTable1 – Economic outlook in the services sector
| Average* | Jan. 17 | Feb. 17 | March 17 | April 17 | |
|---|---|---|---|---|---|
| Composite indicator | 100 | 102 | 104 | 104 | 103 |
| General outlook | –8 | –3 | –2 | –2 | –2 |
| Past activity | 2 | 4 | 4 | 8 | 7 |
| Expected activity | 2 | 0 | 1 | 2 | –1 |
| Expected demand | –1 | 0 | 2 | 0 | –1 |
| Past selling prices | –4 | –6 | –7 | –5 | –9 |
| Expected selling prices | –3 | –8 | –3 | –2 | –6 |
| Past employment | 3 | 13 | 12 | 14 | 14 |
| except temporary work agencies | 1 | 5 | 2 | 6 | 4 |
| Expected employment | 2 | 10 | 12 | 13 | 11 |
| except temporary work agencies | –1 | 4 | 2 | 3 | 4 |
| Investments | |||||
| Past investments | 2 | 6 | 7 | 8 | 11 |
| Expected investments | 1 | 8 | 7 | 7 | 0 |
| Operating balance result | |||||
| Past result | –2 | 4 | –4 | ||
| Expected result | –2 | –6 | –5 | ||
| Cash position | –11 | –12 | –10 | ||
| Difficulties of supply and demand | |||||
| supply and demand | 10 | 12 | 13 | ||
| supply only | 22 | 21 | 24 | ||
| demand only | 32 | 32 | 30 | ||
| Difficulties in recruitment | 27 | 27 | 27 |
- * Average since 1989 for the composite indicator and since 1988 for the balances of opinion
- Source: INSEE, business survey in services
Almost all sub-sector business climates have gone down. Only the climate in professional, scientific and technical activities is stable and the climate in accommodation and food service activities has recovered significantly.
The business climate has decreased in road transport
In road transport, the business climate has decreased (105 after 108 in March) but remains above its long-term average. All balances have gone down but they remain above their long-term average.
The business climate has improved markedly in accommodation and food service activities
In accommodation and food service activities, the business climate has increased by seven points (to 105), returning above its long-term average. In particular, the balances on general outlook and on expected activity and demand have improved significantly and returned above their long-term average.
In information and communication, the business climate has returned just below its average
In information and communication, the business climate has lost two points and has returned just below its mean (to 99). The balances on activity, demand and general outlook have declined. However, the balances on employment remain on a positive track.
The real estate business climate has declined
In real estate, the business climate has lost four points (to 98), and has fallen back below its long-term average. The balances on expected activity and demand have gone down, falling back below their long-term average. However, the other balances are virtually stable.
The business climate is stable in professional, scientific and technical activities
In professional, scientific and technical activities, the business climate is stable (104), above its mean. The balance on past activity has improved, but the balance on expected activity has decreased. The other balances remain on a favourable track.
In administrative and support service activities, the business climate has decreased slightly
In administrative and support service activities, the business climate has declined slightly (108 after 110 in March) but remains clearly above its long-term average. The balances on expected activity, employment and demand have gone down, particularly in temporary work agencies, but remain above their mean. The balances on employment remain far above their long-term average.
tableauTable2 – Business climate composite indicator and balances of opinion by sub-sector in services
| Aggregated classification (NA 2008) at level A21 | Mean* | Jan. 17 | Feb. 17 | March 17 | April 17 |
|---|---|---|---|---|---|
| Road transport (8%) | |||||
| Composite indicator | 100 | 107 | 108 | 108 | 105 |
| Past activity | –8 | –3 | 2 | 4 | –2 |
| Expected activity | –9 | 0 | 6 | –1 | –7 |
| Expected demand | –12 | 2 | –3 | 1 | –3 |
| Past employment | –7 | 5 | 4 | 11 | 4 |
| Expected employment | –10 | 2 | 6 | 3 | 2 |
| General outlook | –23 | –6 | –8 | –6 | –9 |
| Accommodation and food service activities (11%) | |||||
| Composite indicator | 100 | 99 | 102 | 98 | 105 |
| Past activity | –7 | –6 | –11 | 2 | 1 |
| Expected activity | –8 | –6 | –5 | –14 | –7 |
| Expected demand | –10 | –12 | –6 | –14 | –5 |
| Past employment | –4 | –1 | –6 | –4 | 1 |
| Expected employment | –5 | –5 | –7 | –4 | –5 |
| General outlook | –14 | –16 | –11 | –14 | –5 |
| Information and communication (24%) | |||||
| Composite indicator | 100 | 100 | 100 | 101 | 99 |
| Past activity | 8 | 0 | –3 | 10 | 3 |
| Expected activity | 9 | –3 | 0 | 3 | –5 |
| Expected demand | 10 | 1 | 1 | –3 | –6 |
| Past employment | 6 | 23 | 14 | 9 | 9 |
| Expected employment | 10 | 11 | 15 | 14 | 15 |
| General outlook | 0 | –1 | –2 | 1 | –2 |
| Real estate activities (13%) | |||||
| Composite indicator | 100 | 102 | 101 | 102 | 98 |
| Past activity | 7 | 9 | 11 | 6 | 6 |
| Expected activity | 8 | 8 | 4 | 11 | 6 |
| Expected demand | 1 | 5 | 5 | 3 | –1 |
| Past employment | 3 | 4 | 11 | 6 | 5 |
| Expected employment | 2 | 13 | 6 | 4 | 6 |
| General outlook | –2 | 4 | 5 | 2 | 3 |
| Professional, scientific and technical activities (24%) | |||||
| Composite indicator | 100 | 102 | 105 | 104 | 104 |
| Past activity | –1 | 4 | 5 | 4 | 8 |
| Expected activity | –2 | –6 | –2 | –1 | –4 |
| Expected demand | –6 | –2 | 1 | 0 | 0 |
| Past employment | 1 | 10 | 7 | 8 | 7 |
| Expected employment | 0 | 7 | 5 | 6 | 7 |
| General outlook | –9 | –4 | –2 | –4 | –3 |
| Administrative and support service activities (18%) | |||||
| Composite indicator | 100 | 106 | 106 | 110 | 108 |
| Past activity | 6 | 15 | 18 | 18 | 19 |
| Expected activity | 5 | 9 | 8 | 16 | 12 |
| Expected demand | 3 | 9 | 7 | 13 | 7 |
| Past employment | 9 | 23 | 26 | 30 | 35 |
| Expected employment | 7 | 20 | 26 | 30 | 26 |
| General outlook | –5 | 2 | 3 | 4 | 6 |
- The figures in parentheses indicate the weights used to aggregate the sub-sector balances of opinion.
- *Composite indicators: average since 1989 (2006 for road transport); balances of opinion : average since 1988 (2006 for road transport)
- Source: INSEE, monthly business survey in services.
Documentation
Abbreviated Methodology (2017) (pdf,177 Ko)
Pour en savoir plus
Time series : Economic outlook surveys – Services
