


 25 April 2017
2017- n° 103In April 2017, the business climate in manufacturing has reached its highest level
since June 2011 Monthly business survey (goods-producing industries) - April 2017
25 April 2017
2017- n° 103In April 2017, the business climate in manufacturing has reached its highest level
since June 2011 Monthly business survey (goods-producing industries) - April 2017
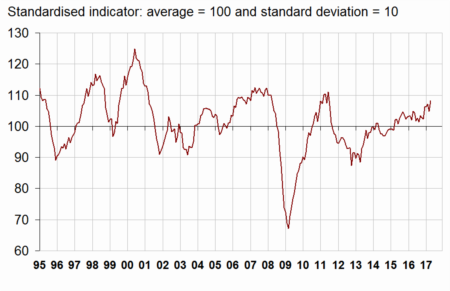
According to the business managers surveyed in April 2017, the business climate in industry has increased by three points. It has reached 108, its highest level since June 2011, significantly above its long-term average (100).
- The balance of industrialists' opinion about their past activity has rebounded
- Revisions
- In the manufacture of food products and beverages, the business climate has slightly increased
- In the manufacture of machinery and equipment goods, the business climate has reached its highest level since April 2008
- The business climate remains above normal in the manufacture of transport equipment
- In “other manufacturing”, the business climate has recovered and has returned to its highest level since June 2011
According to the business managers surveyed in April 2017, the business climate in industry has increased by three points. It has reached 108, its highest level since June 2011, significantly above its long-term average (100).
graphiqueGraph 1 – Business climate in industry - Composite indicator
The turning-point indicator is now in the zone indicating a favourable economic outlook.
graphiqueGraph 2 – Turning-point indicator
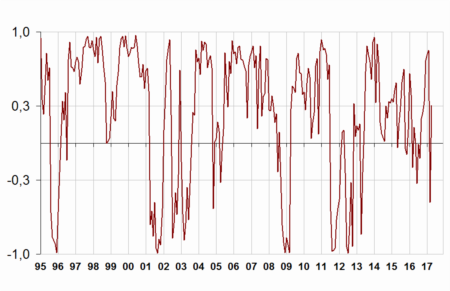
- How to read it: close to 1 (respectively −1), the indicator points to a favourable short-term economic situation (respectively unfavourable). Between −0.3 and +0.3: uncertainty area.
The balance of industrialists' opinion about their past activity has rebounded
In April 2017, the balance of industrialists' opinion on their past activity has rebounded, reaching its highest level since December 2016; that on personal production expectations has recovered. Both are significantly above their normal level.
Business managers are a little less upbeat on general production prospects for the sector. The corresponding balance has slightly decreased but remains significantly above its long-term average, that it has exceeded since February 2015.
In April, overall and export order books, already significantly above normal in March, have refilled.
Finally, almost as industrialists as in March consider that finished-goods inventories are below normal: the corresponding balance remains below its long-term average.
tableauTable 1 – Industrialists' opinion on manufacturing activity
| Manufacturing industry | Ave.* | Jan. 17 | Feb. 17 | March 17 | April 17 |
|---|---|---|---|---|---|
| Composite indicator | 100 | 106 | 107 | 105 | 108 |
| Past activity | 4 | 12 | 8 | 5 | 16 |
| Finished-goods inventory | 13 | 6 | 6 | 7 | 6 |
| Global order books | –18 | –10 | –8 | –9 | –6 |
| Export order books | –14 | –4 | –3 | –5 | –1 |
| Personal production expectations | 5 | 13 | 19 | 11 | 14 |
| General production expectations | –9 | 7 | 5 | 3 | 1 |
- * Long-term average since 1976.
- Source: INSEE - Monthly business tendency survey in industry
Revisions
The business climate in manufacturing in March 2017 has been revised from its first estimation last month, from 104 to 105, due to late answers from businesses that have been taken into account.
The brightening of the business climate in industry in April has mainly arisen from an improvement in machinery and equipment goods and in “other manufacturing”.
In the manufacture of food products and beverages, the business climate has slightly increased
After having decreasing by height points in three months, the business climate has increased by one point in the manufacture of food products and beverages, reaching 102. This slight improvement mainly stems from an increase in the balance of global order books.
In the manufacture of machinery and equipment goods, the business climate has reached its highest level since April 2008
In the manufacture of machinery and equipment goods, the business climate has increased by two points reaching 108, its highest level since April 2008. This increase comes from a further improvement in overall and export order books, which have reached their highest level since summer 2008.
In electrical equipment, the business climate has sharply picked up, hitting its highest level since July 2011. In machinery and equipment, the business climate is virtually stable at its highest level since April 2011. However, it has decreased albeit remaining significantly above its mean in the computer, electronic and optical product industry.
The business climate remains above normal in the manufacture of transport equipment
In the manufacture of transport equipment, the business climate is stable at 106, above its long-term average.
In the manufacture of motor vehicles, trailers and semi-trailers, the business climate has slightly improved especially due to overall and export order books and to the balance on personal production expectations. However, in other transport equipment the order books have thinned and the climate has slightly dipped. In both sectors the climate is above normal.
In “other manufacturing”, the business climate has recovered and has returned to its highest level since June 2011
In overall “other manufacturing”, the business climate has increased by two points and has reached 107, its highest level since June 2011, significantly above normal. This strengthening comes from an improvement in order books and an increase in the balances on past activity and on personal production expectations.
In clothing-textiles, chemicals and in basic metals, the business climate, already above normal, has recovered. It is stable at its highest level since June 2011 in rubber and plastic products. However, it has slightly decreased in wood-paper and in the “other manufacturing industries”.
graphiqueGraph 3 – Business climates in a sector-based approach
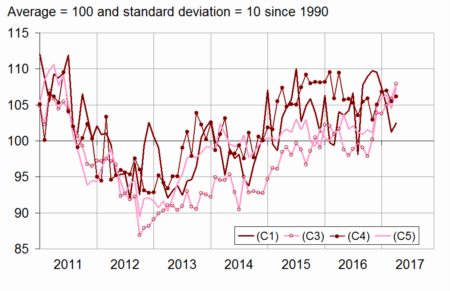
- Legend: (C1): Manufacture of food products and beverages - (C3): Machinery and equipment goods - (C4): Manufacture of transport equipment - (C5): Other manufacturing
tableauTable 2 – Business climates in a sector-based approach
| NA* : (A17) et [A38 et A64] | Weights** (%) | Feb. 17 | March 17 | April 17 |
|---|---|---|---|---|
| (C1) Man. of food products and beverages | 21 | 105 | 101 | 102 |
| (C3) Machinery and equipment goods | 11 | 105 | 106 | 108 |
| [CI] Computer, electronic and optical products | 3 | 108 | 112 | 109 |
| [CJ] Electrical equipment | 3 | 102 | 100 | 106 |
| [CK] Machinery and equipment | 5 | 104 | 105 | 106 |
| (C4) Man. of transport equipment | 15 | 107 | 106 | 106 |
| [CL1] Motor vehicles, trailers and semi-trailers | 7 | 108 | 105 | 107 |
| [CL2] Other transport equipment | 8 | 104 | 105 | 104 |
| (C5) Other manufacturing | 46 | 106 | 105 | 107 |
| [CB] Textiles, clothing industries, leather and footwear industry | 2 | 109 | 106 | 109 |
| [CC] Wood, paper, printing | 5 | 108 | 107 | 106 |
| [CE] Chemicals and chemical products | 9 | 110 | 105 | 109 |
| [CG] Rubber and plastic products | 7 | 107 | 108 | 108 |
| [CH] Basic metals and fabricated metal products | 11 | 103 | 101 | 104 |
| [CM] Other manufacturing industries | 9 | 100 | 102 | 100 |
- * NA: aggregated classification, based on the French classification of activities NAF rév.2.
- ** Weights used to aggregate sub-sector's balances of opinion.
- Source: INSEE - Monthly business tendency survey in industry
Documentation
Methodology (pdf,133 Ko)
Pour en savoir plus
Time series : Industry - Activity and demand
