


 20 April 2017
2017- n° 102In March 2017, oil prices fell back Prices of oil and raw material imports - March 2017
20 April 2017
2017- n° 102In March 2017, oil prices fell back Prices of oil and raw material imports - March 2017
In March 2017, the price of crude oil in euros decreased anew (−6.7%) after a three-month increase (of which +0.9% in February). The prices in euros of all other imported commodities also fell back (−1.9% after +3.1% in February), both those of industrial raw materials (−1.4% after +4.8%) and those of raw food materials (−2.9% after 0.0%).
In March 2017, the price of crude oil in euros decreased anew (−6.7%) after a three-month increase (of which +0.9% in February). The prices in euros of all other imported commodities also fell back (−1.9% after +3.1% in February), both those of industrial raw materials (−1.4% after +4.8%) and those of raw food materials (−2.9% after 0.0%).
Oil price fell back sharply
In March, the price of North Sea crude oil (Brent) in euros fell back sharply (−6.7% after +0.9% in February). It reached an average of €48.6 per barrel, hitting its lower level since November 2016, but nevertheless higher than its March 2016 level (+38.5%). In dollars, the increase was less marked (−6.3% after +1.1%) because the euro appreciated slightly during the month.
graphiqueGraph1 – Oil (Brent)
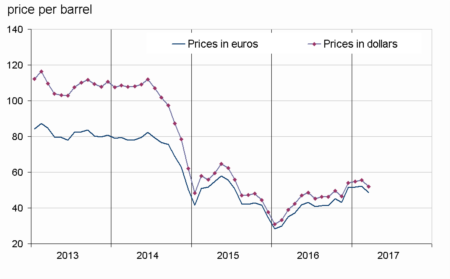
- Source: INSEE
tableauTable1 – Oil and petroleum products
| Prices | Change (%) | |||
|---|---|---|---|---|
| of last month | over the last month | over the last 3 months | over the last 12 months | |
| Brent in $ per barrel | 52.0 | –6.3 | –3.9 | 33.0 |
| Brent in € per barrel | 48.6 | –6.7 | –5.3 | 38.5 |
| Gasoline €/L | 0.369 | –4.1 | –10.0 | 28.4 |
| Gas Oil | 434.4 | –6.4 | –5.4 | 36.1 |
| Heavy fuel | 300.7 | –5.1 | –6.5 | 87.0 |
| Naphtha | 431.9 | –8.1 | –1.0 | 39.6 |
- Prices are in euros per tonne unless otherwise specified
- Source : INSEE
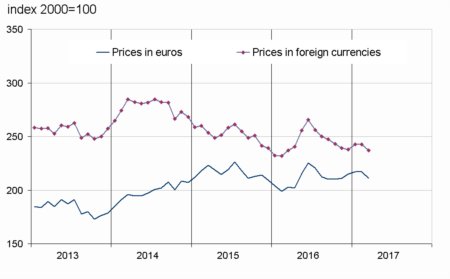
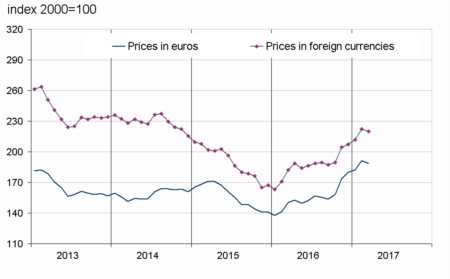
Industrial commodity prices fell back
The prices in euros of industrial raw materials declined in March 2017 (−1.4%) after five months of consecutive gains (+4.8% in February). The prices of agro-industrial raw materials dropped (−3.0% after +7.3%). Indeed, the price of rubber plummeted (−11.3% after +2.2%) because of excess supply, and the price of sawn softwood fell back sharply (−4.6% after +20.9%). The price of tropical wood declined more moderatly (−1.6% after +1.1%). The prices of natural fibers slowed down (+2.0% after +3.5%). However, the price of wood pulp (+0.7% after +0.6%) as well as hide one (+1.5% after +0.4%) accelerated moderatly. Minerals prices fell back (−0.9% after +4.2%), mainly as a result of the price of iron ore (−2.2% after +9.7%); the prices of non-ferrous metals (−0.4% after +2.6%) and those of precious metals (−2.0% after +3.9%) also declined.
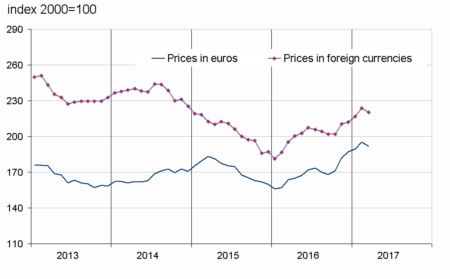
Food commodity prices decreased
In euros, the prices of raw food materials decreased anew (−2.9% after 0.0%). The prices of oil seeds and vegetable oils fell back (−4.2% after +0.4%) as well as those of cereals (−1.3% after +0.1%). The price of sugar also plummeted (−11.9% after −0.8%) suffering a lower demand for the benefit of bioethanol production, while supply is plentiful, especially Brazilian harvests. The prices of tropical foodstuffs slipped back again (−1.1% after −4.3%), driven by the fall in the price of tea (−7.7% after +3.7%). The price of beef meat slowed down (+0.9% after +6.4%).
tableauTable2 – Imported raw materials (excluding energy) in euros
| Index | Changes (%) | |||
|---|---|---|---|---|
| of last month | over the last month | over the last 3 months | over the last 12 months | |
| Food total | 211.0 | –2.9 | –1.8 | 4.0 |
| Tropical foodstuffs | 186.1 | –1.1 | –4.6 | –8.3 |
| Oil seeds, vegetable oils | 239.7 | –4.2 | –2.4 | 13.9 |
| Cereals | 152.8 | –1.3 | 0.1 | 3.1 |
| Sugar | 189.1 | –11.9 | –5.5 | 21.8 |
| Beef meat | 161.5 | 0.9 | 4.3 | –1.8 |
| Industrial raw materials | 188.7 | –1.4 | 4.8 | 25.6 |
| Agricultural raw materials | 131.5 | –3.0 | 4.3 | 19.4 |
| Natural Fibres | 156.8 | 2.0 | 8.8 | 37.2 |
| Natural rubber | 195.4 | –11.3 | 2.6 | 45.2 |
| Hides | 82.7 | 1.5 | 0.6 | 9.6 |
| Wood pulp | 104.6 | 0.7 | 0.5 | 8.6 |
| Tropical wood | 96.2 | –1.6 | –2.6 | –9.6 |
| Sawn softwood | 121.1 | –4.6 | 10.8 | 28.0 |
| Minerals | 218.9 | –0.9 | 5.0 | 27.1 |
| Iron ore | 606.3 | –2.2 | 8.2 | 64.2 |
| Non-ferrous metals | 170.5 | –0.4 | 3.9 | 19.8 |
| Precious metals | 254.0 | –2.0 | 6.3 | 10.4 |
| All commodities | 191.8 | –1.9 | 2.4 | 17.2 |
- Source : INSEE
graphiqueGraph3 – Food
- Source: INSEE
graphiqueGraph2 – Imported raw materials (excluding energy)
- Source: INSEE
graphiqueGraph4 – Industrial raw materials
- Source: INSEE
Pour en savoir plus
Time series : Raw materials prices
