


 13 April 2017
2017- n° 99In March 2017, consumer prices rose by 0.6% over a month and by 1.1% year on year Consumer price index - final results - March 2017
13 April 2017
2017- n° 99In March 2017, consumer prices rose by 0.6% over a month and by 1.1% year on year Consumer price index - final results - March 2017
In March 2017, the Consumer Prices Index (CPI) accelerated to +0.6% over a month after a weak rebound by 0.1% in February. Seasonally adjusted, it was stable, after having decreased by 0.2% in February. Year on year, consumer prices slowed down slightly (+1.2% after +1.3%).
Monthly change: +0.6%; Year-on-year change: +1.1%
In March 2017, the Consumer Prices Index (CPI) accelerated to +0.6% over a month after a weak rebound by 0.1% in February. Seasonally adjusted, it was stable, after having decreased by 0.2% in February. Year on year, consumer prices slowed down slightly (+1.2% after +1.3%).
Over a month, the acceleration resulted from a rebound in the prices of manufactured products after the end of winter sales and from a further rise in tobacco prices. Contrariwise, food prices slipped back due to fresh products. Energy prices fell too, because of a downturn in petroleum product prices. Besides, services prices were at a standstill.
Rebound in the prices of manufactured products
In March 2017, manufactured product prices recovered sharply after the end of winter sales. As sales ended later than last year, the rebound was more pronounced this year (+2.5% versus +1.9% in March 2016). Year on year, the fall in prices eased (−1.0% after −1.6% in February) but it was stronger than in March 2016 (−0.2% in March 2016). Over a month, clothing and footwear prices bounced back strongly (+14.5% after −2.2%). The prices of other manufactured products gathered pace (+0.6% after +0.1%; −0.7% year on year), driven by a rebound in the prices of furniture and furnishings (+3.7%), major household appliances (+0.7%) equipment for sport (+4.1%) and travel goods (+ 3.6%). The decline in the price of new motor cars softened the overall upturn in the prices of other manufactured products. The prices of health products declined again (−0.3% after -0.2%, −2.5% year on year).
tableauTable1 – Detailed figures for various groups
| Items | Weight | Index | Percentage change | |
|---|---|---|---|---|
| 2017 | March 2017 | m-on-m change | y-on-y change | |
| a) All households | ||||
| Overall | 10000 | 101.17 | 0.6 | 1.1 |
| Overall SA* | 10000 | 101.08 | 0.0 | 1.2 |
| Food | 1627 | 101.17 | −0.3 | 0.8 |
| Fresh food | 235 | 106.91 | −2.4 | 4.6 |
| Other food | 1392 | 100.26 | 0.1 | 0.2 |
| Tobacco | 188 | 102.87 | 1.8 | 2.8 |
| Manufactured products | 2617 | 99.63 | 2.5 | −1.0 |
| Clothing and footwear | 433 | 103.31 | 14.5 | −0.7 |
| Medical products | 433 | 95.42 | −0.3 | −2.5 |
| Other manufactured products | 1751 | 99.82 | 0.6 | −0.7 |
| Energy | 748 | 104.27 | −0.5 | 9.9 |
| Petroleum products | 378 | 105.64 | −1.6 | 17.0 |
| Services | 4820 | 101.49 | 0.1 | 1.1 |
| Actual rentals and services for dwellings | 779 | 101.11 | 0.1 | 0.5 |
| Health services | 600 | 100.67 | 0.1 | 0.4 |
| Transport | 282 | 97.60 | −0.9 | 1.4 |
| Communication | 242 | 99.62 | 0.0 | −1.0 |
| Other services | 2917 | 102.29 | 0.2 | 1.5 |
| Total except rents and tobacco | 9183 | 101.19 | 0.7 | 1.2 |
| Total except tobacco | 9812 | 101.14 | 0.6 | 1.1 |
| b) Urban working-class households or households of employees | ||||
| All products excluding tobacco | 9710 | 101.06 | 0.7 | 1.0 |
| c) Households that belong to the lowest equivalized disposable income quintile - France | ||||
| All products excluding tobacco | 9705 | 100.91 | 0.6 | 1.1 |
- *: seasonally adjusted
- Geographical coverage: France excluding Mayotte
- Source: INSEE - Consumer Price Indices
Rise in tobacco prices and downturn in food prices
In March 2017, the price of tobacco rose by 1.8%, as a result of the tax increase that occurred in February. Year on year, it accelerated sharply (+2.8% after +1.0% in February).
In March 2017 food prices edged down (−0.3%) after a rebound of the same magnitude in February (+0.3%). Indeed, fresh food prices fell back significantly (−2.4% after +1.8%). Excluding fresh products, food prices barely rose (+0.1%) after being stable in February. Year on year, food prices slowed down (+0.8% after +1,6%).
Fall in energy prices
In March 2017, energy prices decreased after being stable in February. Over a year, the rise in prices eased: +9.9% in March after +11.4% in February.
This price downturn is mostly due to that in petroleum products prices (−1.6% after +0.2%; +17.0% year on year), in the wake of Brent crude price. It is partially offset by a rebound in the prices of natural gas and city gas (+2.4% after −0.5%; +8.6% year on year). Electricity prices have been stable since September 2016 (−0.3% year on year).
Slight slowdown in services prices
In March 2017, the prices of services were at a standstill (+0.1% month on month after +0.3% in February,) but increased again by 1.1% year on year. Over the month, this deceleration came from a downturn in airfares (−0.9%; +1.4% over a year) and in package holiday prices (−3.5%; +1.9% year on year). The stability in the prices of communication services after their last month's rebound and a smaller rise in the prices of health services (+0.1% after +0.2%) also contributed to the overall slowdown. However, car insurance prices accelerated vigorously (+2.7% after +0.4% last month, reaching +3.3% year-on-year), owing to the end of sales and because some insurers postponed the rise in the terrorist attack tax.
Rebound in core inflation
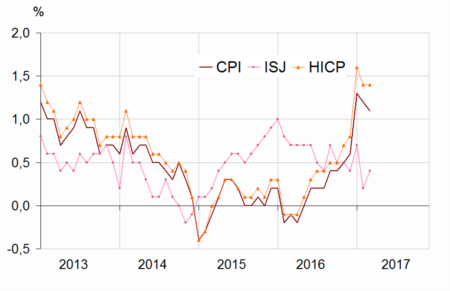
In March 2017, the core inflation indicator (ISJ) bounced back to +0.2% over a month after a decrease of 0.4% in February. Year on year, it slightly accelerated (+0.4% after +0.2%). The Harmonised Index of Consumer Prices (HICP) increased more markedly than in February (+0.7% after +0.2% over a month); over a year, it rose at the same pace as in February (+1.4%).
graphiqueGraph1 – Consumer Price Index (CPI), core inflation (ISJ)* and Harmonised Index of Consumer Prices (HICP)** year-on-year changes
tableauTable2 – Detailed figures for Core inflation* and HICP**
| Items | Weight | Index | Percentage change | |
|---|---|---|---|---|
| 2017 | March 2017 | m-on-m change | y-on-y change | |
| Core inflation - All items | 6134 | 100.85 | 0.2 | 0.4 |
| Food excluding fresh products, meat, milk and exotic products | 744 | 100.37 | 0.0 | 0.4 |
| Manufactured products | 2136 | 99.51 | 0.7 | −0.8 |
| Services including actual rentals and services for dwellings | 3254 | 101.85 | 0.0 | 1.2 |
| HICP - All items | 101.47 | 0.7 | 1.4 | |
- * Core inflation indicator excludes public sector prices, the most volatile consumer prices and the tax measures. Seasonally adjusted, this index is calculated for all households in France excluding overseas departments and territories. (in French “indice d'inflation sous-jacent - ISJ”)
- **HICP: Harmonised Indices of Consumer Prices are inflation figures designed for international comparison between Member states of the European Union. This index is calculated for all households in France excluding Mayotte.
- Source: INSEE - Consumer Price Indices
Revisions
Compared with the provisional estimates published on 31 March 2017, the year-on-year and month-on-month variations in the CPI and the HICP are unchanged.
Documentation
Methodology (pdf,141 Ko)
The Consumer Price Indice: changes for 2017 (pdf,413 Ko)
Pour en savoir plus
