


 31 March 2017
2017- n° 93In February 2017, agricultural products prices accelerated over one year Indices of agricultural prices - February 2017
31 March 2017
2017- n° 93In February 2017, agricultural products prices accelerated over one year Indices of agricultural prices - February 2017
In February 2017, producer prices for agricultural products increased by 9.2% over one year, a sharper rise than in January (+8.3%) and in December (+5.5%). Excluding fruits and vegetables, they were stable over one month and rose by 7.6% over one year.
In February 2017, producer prices for agricultural products increased by 9.2% over one year, a sharper rise than in January (+8.3%) and in December (+5.5%). Excluding fruits and vegetables, they were stable over one month and rose by 7.6% over one year.
Strong rise in the prices of cereals and oleaginous over one year
In February 2017, cereal prices slowed down compared with the previous month (+0.5% after +2.3%). Global demand remained buoyant, facing an abundant supply enhanced by significant crops in the Southern hemisphere. Over one year, cereal prices have been rallying from the low levels they reached in the beginning of 2016 (+15.6 % over one year in February). Since this summer, oleaginous prices have increased significantly (+16.7% over one year), owing to the retreat in global production in 2016 and to the rebound in oil prices which make biodiesel from vegetable oil more attractive.
graphiqueGraph1 – Producer prices of cereals
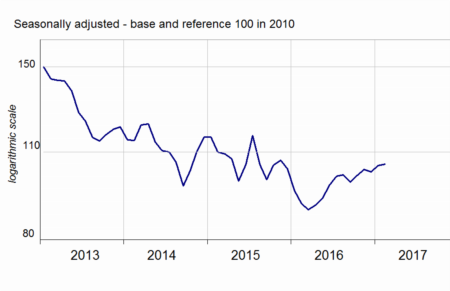
- Source: INSEE
Steep rise in fresh vegetables and potato prices
In February 2017, fresh vegetables prices surged (+52.0%) reflecting the decline in winter productions (endive, leek, lettuce and lamb's lettuce) compared to last year. Potato prices also strongly increased over one year (+37.5%) because of the weak yields in North-Western Europe during the last prodcution campaign. Fresh fruits prices remained dynamic (+7.5 % yoy).
Wine prices declined by 1.0 % over one year reflecting the fall (-8,0 %) in prices of wines without protected designation of origin (“other wines”): their stocks were high; in addition, among these wines, those without geographical indication had to face the Spanish competition.
graphiqueGraph2 – Producer prices of fresh vegetables
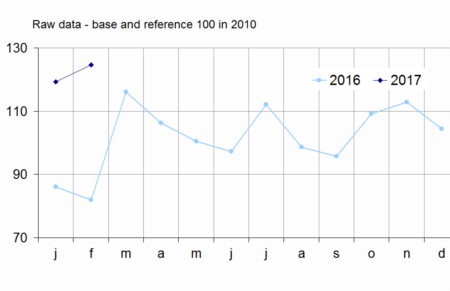
- Source: SSP (ministry in charge of agriculture)
Rise in animal and milk prices
Over one year animal prices kept on rising (+3.5%) owing to the buoyant pig price trend (+22.2%), sustained by the Chinese demand. The recovery in large cattle prices continued (+2.4 % over three months) despite Polish export competition.
graphiqueGraph3 – Producer prices of pigs and large cattle

- Source: INSEE
Cow milk price continued to strengthen (+5.9% from November to January) owing to to strong Chinese demand for dairy products while production declined in the main exporting zones (Southern America, Oceania and Europe).
tableauTable1 – Indices of producer prices of agricultural products (IPPAP)
| Variation as % over | |||||
|---|---|---|---|---|---|
| Weights | Feb. 2017 | a month | 3 months | a year | |
| Agricultural goods output | 1000 | 119.0 | /// | /// | +9.2 |
| excluding fruits and vegetables | 900 | 119.0 | 0.0 | +1.5 | +7.6 |
| Crop output (excluding fruits and vegetables) | 505 | 123.6 | –0.1 | +0.7 | +9.0 |
| Cereals | 188 | 105.3 | +0.5 | +1.8 | +15.6 |
| of which soft wheat | 112 | 103.7 | +0.7 | +3.1 | +19.7 |
| grain maize | 41 | 103.3 | +1.5 | +2.9 | +17.9 |
| Potatoes | 26 | 250.6 | /// | /// | +37.5 |
| Wines | 177 | 132.5 | –0.4 | –2.0 | –1.0 |
| protected designation of origin | 84 | 142.8 | –0.7 | –2.9 | 0.0 |
| other wines | 23 | 135.7 | –0.4 | –2.8 | –8.0 |
| Oleaginous | 49 | 111.0 | +0.5 | +5.6 | +16.7 |
| Horticultural products | 30 | 107.8 | –3.1 | –2.7 | +1.3 |
| Other crop products | 36 | 113.4 | +1.5 | +4.2 | +3.8 |
| Fruits and vegetables (1) | 100 | 118.8 | /// | /// | +26.5 |
| Fresh vegetables | 53 | 124.6 | /// | /// | +52.0 |
| Fresh fruits | 35 | 112.4 | /// | /// | +7.5 |
| Animal output | 395 | 113.2 | +0.1 | +2.9 | +5.8 |
| Animals | 234 | 116.5 | +0.6 | +3.0 | +3.5 |
| of which large cattle | 96 | 117.5 | +0.6 | +2.4 | 0.0 |
| calves | 26 | 110.4 | +0.4 | +5.7 | –3.2 |
| pigs | 54 | 126.6 | +1.7 | +7.7 | +22.2 |
| sheep | 10 | 106.6 | –2.6 | –8.9 | –6.6 |
| poultry | 46 | 108.9 | –0.1 | 0.0 | –1.9 |
| of which chicken | 28 | 108.6 | –0.2 | –0.1 | –1.5 |
| Milk | 147 | 106.4 | /// | +5.5 | +9.1 |
| of which cow milk (2) | 137 | 106.0 | /// | +5.9 | +9.8 |
| Eggs | 15 | 127.4 | –6.1 | –15.8 | +11.5 |
- * Except for fresh fruits, fresh vegetables and potatoes
- /// Absence of result due to the nature of these series
- (1) Including vegetables for industry.
- (2)The January value of cow milk price indice is carried forward in February
- Sources: INSEE, SSP (ministry in charge of agriculture)
Further rise in purchase prices of means of production
In February 2017, intermediate consumption prices kept on increasing (+0.5% after +0.6%), driven by fertilisers (+1.8%) and animal feed (+0.7%). Over one year input prices increased by 1.4%, mainly because of soaring energy prices (+23.0 %) while fertilisers prices went down over by 7.1 %. In February, capital goods prices rose by 0.2% over the month and by 1.1% year on year.
Revisions
The January y-o-y variation in IPPAP has been lowered by 0.1 points. The m-o-m variation in IPAMPA has been revised by 0.1 point, due to raw data revisions, for milk prices especially.
graphiqueGraph4 – Purchase prices of the means of agricultural production

- Sources: INSEE, SSP (ministry in charge of agriculture)
tableauTable2 – Indices of purchase prices of the means of agricultural production (IPAMPA)
| Weights | Feb. 2017 | variation as % over | |||
|---|---|---|---|---|---|
| a month | 3 months | a year | |||
| Total input | 1000 | 107.8 | +0.4 | +1.6 | +1.2 |
| Intermediate consumptions | 764 | 107.9 | +0.5 | +2.2 | +1.4 |
| Energy | 100 | 102.5 | +0.3 | +8.6 | +23.0 |
| Seeds | 57 | 106.5 | +0.1 | –0.7 | –1.8 |
| Fertilisers and soil improvers | 92 | 105.8 | +1.8 | +7.8 | –7.1 |
| Plant protection products | 78 | 97.5 | –0.2 | –1.4 | –0.9 |
| Animal feed | 205 | 113.5 | +0.7 | +1.3 | –0.3 |
| Veterinary expenses | 43 | 119.2 | +0.2 | +0.4 | +2.3 |
| Small equipment and tools | 17 | 107.0 | –1.0 | –1.7 | –1.8 |
| Maintenance of materials | 67 | 114.9 | +0.3 | +1.1 | +1.2 |
| Maintenance of buildings | 9 | 107.7 | 0.0 | +0.4 | +1.9 |
| Other goods and services | 97 | 102.7 | +0.1 | +0.1 | –0.5 |
| Goods and services contributing to investment | 236 | 107.8 | +0.2 | –0.1 | +1.1 |
| Material | 186 | 109.1 | +0.2 | –0.3 | +0.8 |
| Tractors | 79 | 109.9 | +0.5 | –0.1 | +1.2 |
| Machinery and equipment for cultivation | 36 | 110.2 | 0.0 | –0.5 | –0.2 |
| Machinery and equipment for harvesting | 42 | 109.7 | –0.1 | –0.1 | +1.5 |
| Utility vehicles | 18 | 104.0 | –0.1 | –1.0 | –0.1 |
| Buildings | 50 | 103.1 | 0.0 | +0.6 | +2.4 |
- (1) The repayment of the domestic tax on energy product (TICPE) benefiting farmers has been applied in advance for the year 2017
- Sources: INSEE, SSP (ministry in charge of agriculture)
Documentation
Methodology (pdf,122 Ko)
Pour en savoir plus
Time series : Indices of agricultural prices
