


 31 March 2017
2017- n° 87Household consumption expenditure on goods fell back in February 2017 (−0.8%) Household consumption expenditure on goods - February 2017
31 March 2017
2017- n° 87Household consumption expenditure on goods fell back in February 2017 (−0.8%) Household consumption expenditure on goods - February 2017
In February 2017, household consumption expenditure on goods decreased in volume* (−0,8%), after a rebound in the previous month (+0.6%). Expenses on energy fell back strongly; the increase in consumption of food products and engineered goods was not sufficient to offset the downward effect on overall consumption.
In February 2017, household consumption expenditure on goods decreased in volume* (−0,8%), after a rebound in the previous month (+0.6%). Expenses on energy fell back strongly; the increase in consumption of food products and engineered goods was not sufficient to offset the downward effect on overall consumption.

*Volumes are measured at chain-link previous year prices (2010 euro billions) and all figures are trading-day and seasonally adjusted.
graphiqueGraph1 – Total consumption of goods
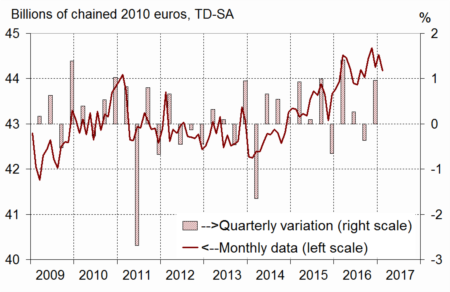
- Source: INSEE
Energy : marked decline
In February 2017, energy consumption fell back strongly (−10.9% after +5.1%), notably the expenses on gas and electricity (−16.5% after +7.6%). This sharp profile comes from strong temperature changes: the warmest February since 2007 succeeded to the coldest January since 2010. Consumption of refined products also declined substantially (−2.6%), mainly because of the fall in domestic heating oil purchases.
graphiqueGraph2 – Breakdown of energy
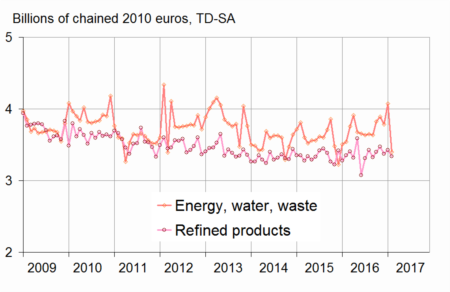
- Source: INSEE
Engineered goods : clear rebound
In February 2017, purchases of engineered goods bouced back clearly (+2.2% after −1.1%). Consumption of textile-clothing contributed the most to this growth.
Durables : recovering
In February, expenses on durables recovered (+0.9%), after two consecutive months of decline. Expenses on household durables sped up (+1.3% after +0.9%), in particular on furnitures. Car purchases recovered a little (+0.4% after −2.6%), driven by a slight upturn in the purchases of new vehicles. Spending on jewellery-clocks were dynamic.
Textile-clothing: strong increase
In February, expenses on textile-clothing bounced back vigorously, reaching their strongest monthly growth since July 2010 (+8.8% after −3.4%). The increase, partly due to the postponement by one week of winter sales, affected textile products and clothing as much as footwear.
Other engineered goods: virtually stable
In February, purchases of other engineered goods were virtually stable (+0.1% after +0,9%) despite a growth in hardware and DIY expenses.
graphiqueGraph3 – Breakdown of engineered goods
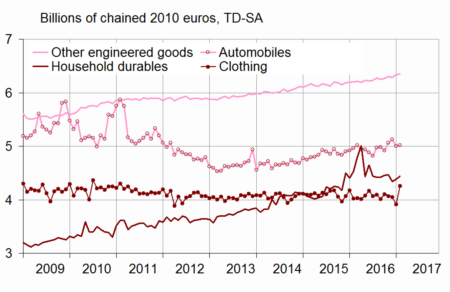
- Source: INSEE
Food products : increasing again
February, consumption of food products continued recovering (+0.5% after +0.6%). Agrifood products increased mainly because of tobacco consumption, while consumption of unprocessed agricultural goods (fresh fish, fruits and vegetables) decreased.
graphiqueGraph4 – Food products, engineered goods and energy
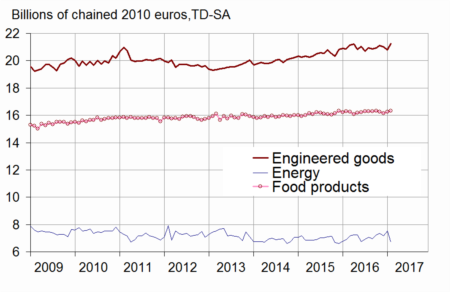
- Source: INSEE
The variation in January 2017 is unchanged
The variation in household expenditure on goods in January 2017 is unchanged (−0.6%). Since the previous publication, new information has been integrated and the seasonal adjustment coefficients have been updated but the slight revisions in different aggregates have offset each other.
tableauTable – Household consumption expenditure on goods
| Weight (1) | Dec. 2016 | Jan. 2017 | Feb. 2017 | Feb. 17 / Feb. 16 | Q / Q-1 (2) | |
|---|---|---|---|---|---|---|
| Food products | 38 | –0.6 | 0.6 | 0.5 | 0.3 | −0.3 |
| Engineered goods | 45 | –0.5 | –1.1 | 2.2 | 1.8 | 0.3 |
| - Durables | 22 | –0.5 | –1.4 | 0.9 | 0.0 | –0.1 |
| Including: | ||||||
| - Automobiles | 12 | 1.2 | –2.6 | 0.4 | 1.0 | 1.1 |
| - Household durables | 8 | –2.8 | 0.9 | 1.3 | –2.1 | –1.3 |
| - Textile-clothing | 9 | –0.5 | –3.4 | 8.8 | 5.9 | 0.3 |
| - Other engineered goods | 13 | –0.4 | 0.9 | 0.1 | 2.2 | 0.8 |
| Energy | 17 | –2.8 | 5.1 | −10.9 | –2.5 | –0.7 |
| - Energy, water, waste | 10 | –2.8 | 7.6 | –16.5 | –4.0 | –0.8 |
| - Refined products | 7 | –2.9 | 1.6 | –2.6 | –0.4 | –0.6 |
| Total | 100 | –1.0 | 0.6 | –0.8 | 0.5 | –0.1 |
| - Including Manufactured goods | 84 | –0.7 | –0.2 | 1.3 | 1.6 | 0.2 |
- (1) Weighting in the consumption expenditure on goods in value in 2016
- (2) Last three months / previous three months
Documentation
Methodology (pdf,23 Ko)
Pour en savoir plus
