


 23 March 2017
2017- n° 76In March 2017, the economic climate is virtually stable in the building construction
industry Monthly survey of building - March 2017
23 March 2017
2017- n° 76In March 2017, the economic climate is virtually stable in the building construction
industry Monthly survey of building - March 2017
According to the business managers in the building construction industry surveyed in March 2017, the business climate is virtually stable. The composite indicator has lost on point and stands at 99, just below its long-term average (100). Its February level has been revised upward by one point since the first estimation, at 100, because of late businesses' answers that have been taken into account.
According to the business managers in the building construction industry surveyed in March 2017, the business climate is virtually stable. The composite indicator has lost on point and stands at 99, just below its long-term average (100). Its February level has been revised upward by one point since the first estimation, at 100, because of late businesses' answers that have been taken into account.
graphiqueGraph1 – Business climate composite indicator

The turning point indicator remains in the favourable outlook zone.
graphiqueGraph2 – Turning-point indicator
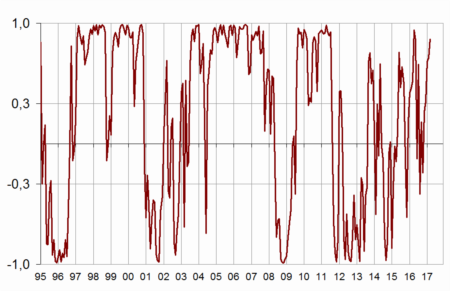
- Note: close to 1 (respectively −1), it indicates a favourable climate (respectively unfavourable). Between +0.3 and −0.3: uncertainty area
More business managers indicate a decrease in their past activity
In March 2017 again, more business managers have indicated a decrease in their past activity. The corresponding balance has returned below its long-term average. In contrast, the balance of opinion on expected activity has increased again and exceeds its long-term average level even more.
graphiqueGraph3 – Activity tendency in building construction

tableauTable1 – Building industry economic outlook
| Mean* | Dec. 16 | Jan. 17 | Feb. 17 | March 17 | |
|---|---|---|---|---|---|
| Composite indicator | 100 | 98 | 99 | 100 | 99 |
| Past activity | –4 | –2 | 9 | 0 | –6 |
| Expected activity | –6 | 1 | –5 | –3 | 0 |
| Gen. business outlook | –19 | 0 | |||
| Past employment | –6 | –16 | –15 | –11 | –10 |
| Expected employment | –5 | –8 | –7 | –10 | –6 |
| Opinion on order books | –24 | –39 | –31 | –30 | –33 |
| Order books (in month) | 5.5 | 6.8 | 6.8 | 6.9 | 7.0 |
| Production capacity utilisation rate | 88.4 | 86.9 | 87.1 | 87.0 | 87.0 |
| Obstacles to production increase (in %) | 32 | 25 | 25 | 25 | 26 |
| - Because of workforce shortage (in %) | 13.9 | 4.9 | 5.1 | 5.2 | 6.0 |
| Recruiting problems (in %) | 57 | 48 | |||
| Expected prices | –15 | –19 | –13 | –14 | –13 |
| Cash-flow position | –10 | –21 | |||
| Repayment period | 30 | 33 |
- * Mean since September 1993.
- Source: INSEE, French business survey in the building industry
Fewer business managers forecast a cut in their staff size
In March 2017, slightly fewer business managers than in February have indicated a drop in their staff size over the last three months. The corresponding balance has risen by 10 points since October 2016 without reaching its long-term average. The balance of opinion on expected staff size has increased sharply and has almost hit its long-term average.
graphiqueGraph4 – Workforce size tendency in building construction

Order books judged less filled
While it has regularly improved for two years, business managers' opinion on order books has slightly fallen back in March 2017. The corresponding balance remains well below its long-term average. With their present staff size, business managers consider that their order books provide 7.0 months of work, a level close to last month and above its long-term average (5.5 months).
graphiqueGraph5 – Order books

Production capacity remains less used than on long-term average
After having recovered for a year and a half, the production capacity utilisation rate has weakly hovered around 87% since August 2016. In March, it is stable at 87.0%. It has been below its long-term average (88.4%) since January 2012. Only one business manager out of four has reported difficulties in increasing output, compared to one out of three in average since 1993.
graphiqueGraph6 – Production capacity utilisation rate

Prices prospects close to normal
In March 2017, slightly more business managers than in February have announced that they were going to increase their prices during the next three months. The corresponding balance has hit its highest level since August 2011 and stands slightly above its long-term average.
Documentation
Abbreviated Methodology (2017) (pdf,176 Ko)
Pour en savoir plus
