


 21 March 2017
2017- n° 73In February 2017, the prices of industrial raw materials gathered pace Prices of oil and raw material imports - February 2017
21 March 2017
2017- n° 73In February 2017, the prices of industrial raw materials gathered pace Prices of oil and raw material imports - February 2017
In February 2017, the price of crude oil in euros increased modestly again (+0.9% after +0.7%). It reached an average of €52.1 per barrel, hitting its higher level since July 2015. The prices in euros of all other imported commodities accelerated (+3.1% after +1.3% in January), due to industrial raw materials (+4.8% after +1.4%). The prices of raw food materials were unchanged (after +1.1% in January).
In February 2017, the price of crude oil in euros increased modestly again (+0.9% after +0.7%). It reached an average of €52.1 per barrel, hitting its higher level since July 2015. The prices in euros of all other imported commodities accelerated (+3.1% after +1.3% in January), due to industrial raw materials (+4.8% after +1.4%). The prices of raw food materials were unchanged (after +1.1% in January).
Oil price increased modestly
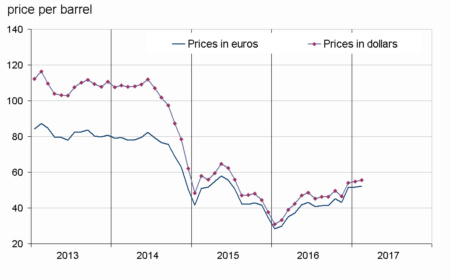
In February, the price of North Sea crude oil (Brent) in euros increased modeslty (+0.9% after +0.7% in January). In dollars, the increase was similar (+1.5% after +16.4%) because the euro was practically stable during the month.
graphiqueGraph1 – Oil (Brent)
- Source: INSEE
tableauTable1 – Oil and petroleum products
| Prices | Change (%) | |||
|---|---|---|---|---|
| of last month | over the last month | over the last 3 months | over the last 12 months | |
| Brent in $ per barrel | 55.5 | 1.1 | 19.5 | 67.1 |
| Brent in € per barrel | 52.1 | 0.9 | 21.0 | 74.1 |
| Gasoline €/L | 0.385 | –4.8 | 7.3 | 70.5 |
| Gas Oil | 464.1 | 1.3 | 17.1 | 68.5 |
| Heavy fuel | 317.0 | 1.0 | 19.9 | 105.6 |
| Naphtha | 469.9 | 0.7 | 21.7 | 79.4 |
- Prices are in euros per tonne unless otherwise specified
- Source : INSEE
Industrial commodity prices accelerated sharply
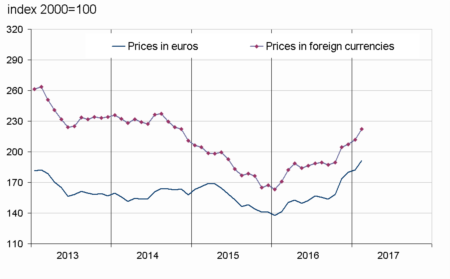
The prices in euros of industrial raw materials accelerated sharply in February (+4.8% after +1.4% in the previous month). The prices of agro-industrial raw materials increased strongly (+7.3% after +0.2%). The price of sawn softwood skyrocketed (+20.9% after −4.0%). The price of wood pulp bounced back (+0.6% after −0.8%), as well as hide one (+0.4% after −1.2%), and tropical wood one (+1.1% after −2.1%). The prices of natural fibers remained dynamics (+3.5% after +3.0%). However, the price of rubber slowed markedly (+2.2% after +13.2%). Minerals prices increased more than in January (+4.2% after +1.7%), since the price of iron speeded up sharply (+9.7% after +0.9%), along with non-ferrous metals ones (+2.6% after +1.7%) notably the nickel price (+6.2% after −9.8%) buoyed by the closure of several mines in Philippines. The prices of precious metals increased sharply again (+3.9% after +4.3%).
Food commodity prices were unchanged
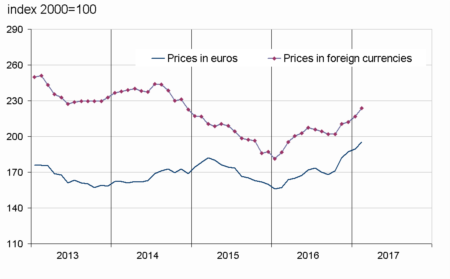
In euros, the prices of raw food materials stabilised after a three-month increase. The price rise in oil seeds and vegetable oils eased (+0.4% after +1.5%) as that of cereals (+0.1% after +1.4%). The prices of tropical foodstuffs slipped back (−4.3% after +0.9 %), driven by the fall in cocoa price, declining since June 2016 (−7.8% after −4.4%). The price of sugar also fell back (−0.8% after +8.2%). However, the price of beef meat bounced back (+6.4% after −2.9%).
tableauTable2 – Imported raw materials (excluding energy) in euros
| Index | Changes (%) | |||
|---|---|---|---|---|
| of last month | over the last month | over the last 3 months | over the last 12 months | |
| Food total | 217.2 | 0.0 | 2.9 | 9.1 |
| Tropical foodstuffs | 188.3 | –4.3 | –9.3 | –3.5 |
| Oil seeds, vegetable oils | 250.2 | 0.4 | 5.9 | 19.3 |
| Cereals | 154.9 | 0.1 | 5.5 | 3.9 |
| Sugar | 214.6 | –0.8 | –1.0 | 59.6 |
| Beef meat | 160.1 | 6.4 | 18.0 | –1.4 |
| Industrial raw materials | 191.3 | 4.8 | 10.0 | 35.1 |
| Agro-industrial raw materials | 135.5 | 7.3 | 13.1 | 30.4 |
| Natural fibers | 153.7 | 3.5 | 9.9 | 32.5 |
| Natural rubber | 220.3 | 2.2 | 31.5 | 96.2 |
| Hides | 81.5 | 0.4 | –1.0 | 11.2 |
| Wood pulp | 103.9 | 0.6 | 2.1 | 7.2 |
| Tropical wood | 97.8 | 1.1 | 1.7 | –9.1 |
| Sawn softwood | 126.9 | 20.9 | 23.9 | 55.2 |
| Minerals | 221.0 | 4.2 | 9.3 | 36.8 |
| Iron ore | 620.1 | 9.7 | 25.0 | 101.1 |
| Non-ferrous metals | 171.3 | 2.6 | 5.4 | 26.0 |
| Precious metals | 259.1 | 3.9 | 4.0 | 16.4 |
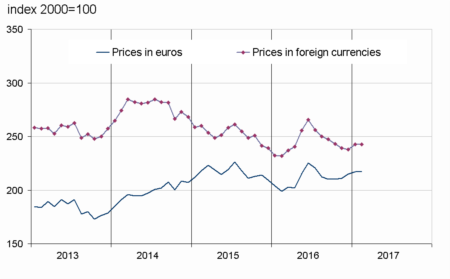
| All commodities | 195.5 | 3.1 | 7.4 | 24.4 |
- Source: INSEE
graphiqueGraph3 – Food
- Source: INSEE
graphiqueGraph2 – Imported raw materials (excluding energy)
- Source: INSEE
graphiqueGraph4 – Industrial raw materials
- Source: INSEE
Pour en savoir plus
Time series : Raw materials prices
