


 15 March 2017
2017- n° 65In February 2017, consumer prices rose by 0,1% over a month and by 1.2% year on year Consumer price index - final results - February 2017
15 March 2017
2017- n° 65In February 2017, consumer prices rose by 0,1% over a month and by 1.2% year on year Consumer price index - final results - February 2017
In February 2017, the Consumer Prices Index (CPI) recovered a little, at +0.1% over a month after a decrease by 0.2% in January. Seasonally adjusted, it edged down by 0.2%, after having risen by 0.7% in January. Year on year, consumer prices slowed down slightly (+1.2% after +1.3%).
Monthly change: +0.1%; Year-on-year change: +1.2%
In February 2017, the Consumer Prices Index (CPI) recovered a little, at +0.1% over a month after a decrease by 0.2% in January. Seasonally adjusted, it edged down by 0.2%, after having risen by 0.7% in January. Year on year, consumer prices slowed down slightly (+1.2% after +1.3%).
Over a month, the slight increase resulted from a rebound in services prices and a rise in tobacco price. Food prices decelerated slightly due to fresh food prices. Winter sales having continued in February, manufactured products prices fell again, thus limiting the overall rebound. At last, energy prices were stable after five months of sharp increase.
Slight rebound in services prices
In February 2017, services prices picked up to +0.3% over a month after a small downturn in the previous month. Year on year, they accelerated to +1.1% after +0.9% in January. Over a month, the rebound resulted mainly from these of airfares and communication. Indeed, airfares rebounded (+1.8%; +0.8% year on year), after a seasonnal fall in January (−11.8%). Prices of communication services recovered too (+0.7% after −3.4%; −0.3% year on year), due to a rise in some fees of mobile phone plans. Accomodation services prices grew sharply (+2.1% after −0.3%; +3.0% year on year). Health services prices rose again slightly (+0.2%; as in January; +0.3% year on year).
tableauTable1 – Detailed figures for various groups
| Items | Weight | Index | Percentage change | |
|---|---|---|---|---|
| 2017 | Feb. 2017 | m-on-m change | y-on-y change | |
| a) All households | ||||
| Overall | 10000 | 100.53 | 0.1 | 1.2 |
| Overall SA* | 10000 | 101.05 | −0.2 | 1.3 |
| Food | 1627 | 101.46 | 0.3 | 1.6 |
| Fresh food | 235 | 109.51 | 1.8 | 11.0 |
| Other food | 1392 | 100.17 | 0.0 | 0.1 |
| Tobacco | 188 | 101.04 | 0.9 | 1.0 |
| Manufactured products | 2617 | 97.21 | −0.3 | −1.6 |
| Clothing and footwear | 433 | 90.21 | −2.2 | −3.0 |
| Medical products | 433 | 95.67 | −0.2 | −2.4 |
| Other manufactured products | 1751 | 99.21 | 0.1 | −0.9 |
| Energy | 748 | 104.79 | 0.0 | 11.4 |
| Petroleum products | 378 | 107.32 | 0.2 | 21.8 |
| Services | 4820 | 101.37 | 0.3 | 1.1 |
| Actual rentals and services for dwellings | 779 | 100.99 | 0.1 | 0.4 |
| Health services | 600 | 100.59 | 0.2 | 0.3 |
| Transport | 282 | 98.52 | 1.2 | 1.9 |
| Communication | 242 | 99.59 | 0.7 | −0.3 |
| Other services | 2917 | 102.05 | 0.3 | 1.4 |
| Total except rents and tobacco | 9183 | 100.53 | 0.1 | 1.3 |
| Total except tobacco | 9812 | 100.52 | 0.1 | 1.2 |
| b) Urban working-class households or households of employees | ||||
| All products excluding tobacco | 9710 | 100.37 | 0.1 | 1.1 |
| c) Households that belong to the lowest equivalized disposable income quintile - France | ||||
| All products excluding tobacco | 9705 | 100.28 | 0.1 | 1.2 |
- *: seasonally adjusted
- Geographical coverage: France excluding Mayotte
- Source: INSEE - Consumer Price Indices
Rise in tobacco price and slight slowdown in food prices
In Februay 2017, tobacco price grew by 0.9% after five months of stability, mainly because of tax increase. Year on year, it accelerated sharply (+1.0% after +0.1% in January).
Food prices decelerated slightly in February (+0.3% after +0.4%) due to a clear slowdown in fresh food prices (+1.8% after +2.8%). Excluding fresh products, food prices were stable over a month and rose by +0.1% year on year, as in the previous month.
Further fall in the prices of manufactured goods
In February 2017, winter sales ending later this year, manufactured product prices kept falling (−0.3%), unlike in February 2016 (+1.0%). Year on year, the drop in these prices was clearly sharper (−1.6% after −0.3% in January). Over a month, clothing and footwear prices dropped again sharply (−2.2% after −12.4%; −3.0% year on year). Manufactured products prices barely edged up (+0.1% after −0.4%; −0.9% year on year). A new fall in the prices of furniture and furnishings (−0.7%) and major household appliances (−0.3%) was offset by rising prices for plants and flowers (+2.3%), games and toys (+0.8%), newspapers and periodicals (+0.7%) and jewellery (+0.6%).
Stability in energy prices
In February 2017, energy prices were unchanged after marked increases in the five previous months. Year on year, the rise in prices was steeper again: +11.4% after +10.3% in the previous month.
The monthly stability came in the one hand from a slight rise in petroleum products prices (+0.2% after +7.5%; +21.8% year on year), in the wake of Brent crude price, and on the other hand, from a downturn in the prices of natural gas and city gas (−0.5% after +5.0%; +2.9% year on year). Electricity prices have been stable since September 2016 (−0.3% year on year).
Downturn in core inflation
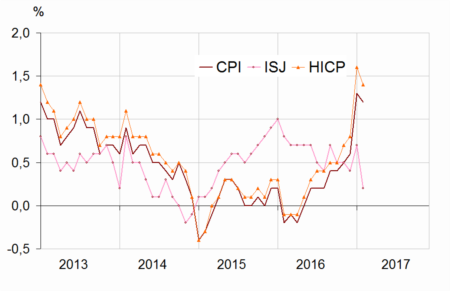
In February 2017, the core inflation indicator (ISJ) edged down by 0.4% over a month after a rebound of equal magnitude in January. Year on year, it slowed down sharply (+0.2% after +0.7% in the previous month). The Harmonised Index of Consumer Prices (HICP) recovered (+0.2% after −0.3% over one month); year on year, it rose at a slightly slower pace than in January (+1.4% after +1.6%).
graphiqueGraph1 – Consumer Price Index (CPI), core inflation (ISJ)* and Harmonised Index of Consumer Prices (HICP)** year-on-year changes
tableauTable2 – Detailed figures for Core inflation* and HICP**
| Items | Weight | Index | Percentage change | |
|---|---|---|---|---|
| 2017 | Feb. 2017 | m-on-m change | y-on-y change | |
| Core inflation - All items | 6134 | 100.60 | −0.4 | 0.2 |
| Food excluding fresh products, meat, milk and exotic products | 744 | 100.32 | −0.1 | 0.3 |
| Manufactured products | 2136 | 98.78 | −1.5 | −1.4 |
| Services including actual rentals and services for dwellings | 3254 | 101.80 | 0.0 | 1.2 |
| HICP - All items | 100.73 | 0.2 | 1.4 | |
- * Core inflation indicator excludes public sector prices, the most volatile consumer prices and the tax measures. Seasonally adjusted, this index is calculated for all households in France excluding overseas departments and territories. (in French “indice d'inflation sous-jacent - ISJ”)
- **HICP: Harmonised Indices of Consumer Prices are inflation figures designed for international comparison between Member states of the European Union. This index is calculated for all households in France excluding Mayotte.
- Source: INSEE - Consumer Price Indices
Revisions
Compared to the provisional estimates published on 28 February 2017, the year-on-year and month-on-month rates of change in the CPI in February 2017 are unchanged. For the HICP, the monthly change is increased by 0.1 points and the year-on-year change is confirmed.
Documentation
Methodology (pdf,141 Ko)
The Consumer Price Indice: changes for 2017 (pdf,413 Ko)
Pour en savoir plus
