


 28 February 2017
2017- n° 60In December 2016, the sales volume declined in the whole retail trade Sales volume in the retail trade and personal services - December 2016
28 February 2017
2017- n° 60In December 2016, the sales volume declined in the whole retail trade Sales volume in the retail trade and personal services - December 2016
In December 2016, the sales volume decreased in retail trade (−0.5% after a stability in November) and declined in trade and repair of motor vehicles and motorcycles (−1.1% after +2.2%). It rose slightly in accommodation and food service activities (+0.3% after +0.5%) and levelled off in household services (+0.1% after +1.8%).

Every index in this issue (except those on large scale food retailing survey) is in volume (tax excluded), seasonally and working day adjusted (SA-WDA).
From next month onwards, turnover and sales volume releases for the third sector will be all in volume and by aggregated sector (trade / services). EMAGSA survey results will be released in a specific issue.
In December 2016, the sales volume decreased in retail trade (−0.5% after a stability in November) and declined in trade and repair of motor vehicles and motorcycles (−1.1% after +2.2%). It rose slightly in accommodation and food service activities (+0.3% after +0.5%) and levelled off in household services (+0.1% after +1.8%).
graphiqueGraph1 – Sales volume in the retail trade and personal services
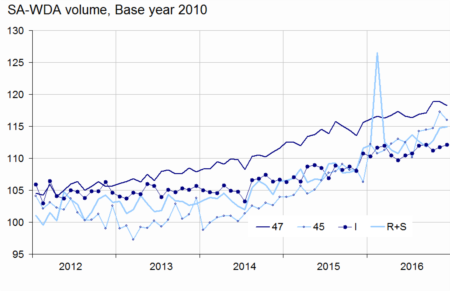
- Source: INSEE
Decline in retail trade
The sales volume in retail trade except of motor vehicles and motorcycles shrank in December 2016, (−0.5%) after a stability in November. According to early estimates, it should go on falling in January 2017 (−0.9%).
The sales volume decreased again in specialised stores (−0.6% after −0.2%), especially in the retail sale of other goods (perfumes, clothes, etc.: −0.4%), in the retail trade of food (−2.0%) and in that of information and communication equipment (−1.9%).
It fell back slightly in non specialised stores (−0.2% after +0.1%) and significantly in retail trade not in stores (−1.8% after +1.3%).
The sales volume in retail trade except of motor vehicles and motorcycles increased sharply over the last quarter 2016 (+1.6%, q-o-q) and year on year (+3.6% y-o-y).
tableauTable1 – Variation of sales volume in the retail trade and personal services
| Change in % | |||||
|---|---|---|---|---|---|
| NACE Rev.2 Classification | Weight | Dec./ Nov. | Nov./Oct. | q-o-q (1) | y-o-y (2) |
| 47 Retail trade, except of motor vehicles and motorcycles | 1000 | –0.5 | 0.0 | 1.6 | 3.6 |
| 471 Retail sale in non-specialized stores | 370 | –0.2 | 0.1 | 0.7 | 2.9 |
| 472 to 477 Retail sale in specialized stores | 572 | –0.6 | –0.2 | 2.2 | 4.1 |
| 478 and 479 Retail trade not in stores | 58 | –1.8 | 1.3 | 1.1 | 2.8 |
| 45 Trade and repair of motor vehicles and motorcycles | 1000 | –1.1 | 2.2 | 2.7 | 7.8 |
| I Accommodation and food service activities | 1000 | 0.3 | 0.5 | 0.1 | 2.3 |
| R+S Household services | 1000 | 0.1 | 1.8 | 1.3 | 4.5 |
| R Arts, entertainment and recreation | 422 | –0.4 | 2.2 | –0.3 | 8.4 |
| S Other service activities | 578 | 0.6 | 1.5 | 2.6 | 1.5 |
- (1) Quarter-on-quarter: last three months / previous three months.
- (2) Year-on-year: last three months / same three months of the previous year.
- The codes correspond to different levels of aggregation of the classification NAF rev.2
- Source: INSEE
tableauTable2 – Sales volume in the retail trade: early estimate*
| Change in % | ||
|---|---|---|
| Jan. 2017/ Dec. 2016 | Jan. 2017/ Jan. 2016 | |
| 47 Retail trade. except of motor vehicles and motorcycles | –0.9 | 0.9 |
- * Econometric estimate from a set of sources available within 30 days after the end of the reference month
- Source: INSEE
Sharp downturn in trade and repair of motor vehicles and motorcycles
The sales volume in trade and repair of motor vehicles and motorcycles slipped back sharply in December 2016 (−1.1%) after a significant acceleration in November (+2.2%). The decrease affected all subsectors but was particularly marked in sale of motor vehicle parts and accessories (−3.3%).
The sales volume of the whole sector rose sharply over the last quarter 2016 (+2.7%. q-o-q) and considerably year on year (+7.8% y-o-y).
tableauTable3 – Sales volume in the retail trade and personal services
| Change in % | |||||
|---|---|---|---|---|---|
| NACE Rev.2 Classification | Weight | Dec. 2016 | Dec./ Nov. | Nov./Oct. | q-o-q (1) |
| 47 Retail trade. except of motor vehicles and motorcycles | 1000 | 118.2 | –0.5 | 0.0 | 1.6 |
| 471 Non-specialised stores | 370 | 111.8 | –0.2 | 0.1 | 0.7 |
| 472 to 477 Specialised stores | 572 | 122.2 | –0.6 | –0.2 | 2.2 |
| 472 Retail sale of food. beverages and tobacco in specialised stores | 48 | 133.2 | –2.0 | 0.0 | 2.9 |
| 473 Retail sale of automotive fuel | 77 | 95.5 | 0.1 | 0.2 | –0.4 |
| 474 Retail sale of information and communication equipment | 28 | 181.2 | –1.9 | –0.6 | 3.6 |
| 475 Retail sale of other household equipment | 113 | 104.4 | –0.4 | 0.0 | 1.4 |
| 476 Retail sale of cultural and recreation goods | 48 | 107.4 | –0.1 | –2.1 | 0.9 |
| 477 Retail sale of other goods in specialised stores | 259 | 132.2 | –0.4 | –0.1 | 2.9 |
| 478 et 479 Retail trade not in stores | 58 | 120.2 | –1.8 | 1.3 | 1.1 |
| 45 Wholesale and retail trade and repair of motor vehicles and motorcycles | 1000 | 116.0 | –1.1 | 2.2 | 2.7 |
| 451 Sale of motor vehicles | 671 | 113.7 | –0.2 | 2.1 | 3.4 |
| 452 Maintenance and repair of motor vehicles | 78 | 106.6 | –1.4 | 2.5 | 1.8 |
| 453 Sale of motor vehicle parts and accessories | 227 | 128.7 | –3.3 | 2.7 | 1.3 |
| 454 Sale. maintenance and repair of motorcycles and related parts and accessories | 24 | 91.4 | –1.6 | 0.4 | 1.2 |
| I Accommodation and food service activities | 1000 | 112.1 | 0.3 | 0.5 | 0.1 |
| 55 Accommodation | 239 | 104.8 | 0.8 | 2.0 | –0.8 |
| 56 Food and beverage service activities | 761 | 114.4 | 0.2 | 0.1 | 0.3 |
| 561 Restaurants… | 560 | 115.1 | 0.0 | 0.2 | 0.4 |
| 562 Event catering… | 119 | 105.9 | 0.5 | –0.5 | 0.7 |
| 563 Beverage serving activities | 82 | 122.3 | 0.8 | 0.0 | –1.0 |
| R+S Household services | 1000 | 114.9 | 0.1 | 1.8 | 1.3 |
| R Arts. entertainment and recreation | 422 | 122.4 | –0.4 | 2.2 | –0.3 |
| 90 Creative. arts and entertainment activities | 116 | 114.0 | 4.3 | 8.7 | –1.7 |
| 91 Libraries. archives. museums… | 10 | 133.9 | 0.7 | –0.5 | 3.2 |
| 92 Gambling and betting activities | 106 | 121.8 | 2.4 | 2.3 | 2.4 |
| 93 Sports activities and amusement... | 190 | 127.2 | –4.3 | –0.8 | –1.1 |
| S Other service activities | 578 | 109.5 | 0.6 | 1.5 | 2.6 |
| 95 Repair of computers… | 206 | 94.9 | 2.9 | –0.3 | 5.1 |
| 96 Other personal service activities | 372 | 117.5 | –0.4 | 2.3 | 1.5 |
- (1) Quarter-on-quarter: last three months / previous three months.
- Source: INSEE
Slight rise in accommodation and food services
In December 2016, the sales volume grew slightly in accommodation and food service activities (+0.3% after +0.5% in November). It slowed down a little in accommodation (+0.8% after +2.0%). It increased slightly in food and beverage service activities (+0.2% after +0.1%) thanks to the rebound in beverage serving activities (+0.8% after a stability) and in event catering and other food services (+0.5% after −0.5%).
The sales volume of the whole sector was broadly steady over the last quarter 2016 (+0.1% q-o-q) and rose year on year (+2.3% y-o-y).
Near stability in household services
In December, the sales volume in household services was virtually stable (+0.1%) after an acceleration in November (+1.8%). The strong decrease of sales volume in sports activities and amusement (−4.3%) was offset by increases in repair of computers (+2.9%), in creative, arts and entertainment activities (+4.3%) and in gambling and betting activities (+2.4%).
The sales volume in household services grew strongly over the fourth quarter (+1.3% q-o-q) and year on year (+4.5% y-o-y).
Revisions
The variation in the sales volume for November 2016 was lowered by 0.1 points in retail trade and repair of motor vehicles and motocycles. It was inchanged in all other sectors.
In January 2017, the turnover grew again in large-scale food retailing
In January 2017, the turnover in large-scale food retailing rose at the same pace as in December 2016 (+0.3%). Sales of automotive fuel accelerated again (+6.7% after +4.9% in December). Those of non-food products picked up sharply (+4.7% after −4.8%). However, sales of food products declined (−1.4% after +0.4%).
tableauTable4 – Monthly turnover indices in large-scale food retailing
| Change in % | ||||
|---|---|---|---|---|
| Jan. 17/ Dec. 16 | Dec. 16/ Nov. 16 | q-o-q (1) | y-o-y (1) | |
| Turnover | 0.3 | 0.3 | 0.4 | 0.8 |
| Including | ||||
| Sales of food products | –1.4 | 0.4 | –1.0 | –0.5 |
| Sales of non-food products | 4.7 | –4.8 | –3.0 | –2.7 |
| Sales of automotive fuel | 6.7 | 4.9 | 11.1 | 12.6 |
- (1) Quarter-on-quarter: last three months / previous three months.
- Source: INSEE - Monthly survey on large scale food retailing (Emagsa)
Documentation
Methodology (pdf,121 Ko)
Pour en savoir plus
