


 28 February 2017
2017- n° 61In January 2017, overall agricultural producer prices still sharply increased over
one year Indices of agricultural prices - January 2017
28 February 2017
2017- n° 61In January 2017, overall agricultural producer prices still sharply increased over
one year Indices of agricultural prices - January 2017
In January 2017 overall agricultural prices rose again sharply over one year (+8.4% after +6.7 % in December). Excluding fruits and vegetables, they were stable over the month and increased by 7.0% over one year.

Warning : The seasonal adjustment of the seasonal series of producer price index have been reestimated including the year 2016
In January 2017 overall agricultural prices rose again sharply over one year (+8.4% after +6.7 % in December). Excluding fruits and vegetables, they were stable over the month and increased by 7.0% over one year.
Rebound in cereals prices and more marked rise in oleaginous prices
In January 2017, cereals prices picked up (+2.3% after –1.0%; +9.4% over one year after –1.1% in December). In the United-States, very low temperatures raised concerns about autumn seed germination of soft wheat. Furthermore, the maïze European supply was barely able to fill the continental demand, noticeably these intented to feed manufacturing. Oleaginous prices accelerated (+12.7% over one year after +6.2%) due noticeably to the drop in soy global stocks and to the floods in Argentina, which is one of the main soy producer. Soy and rape prices are correlated due to their common use by agri-food or fuel industries.
graphiqueGraph1 – Producer prices of cereals
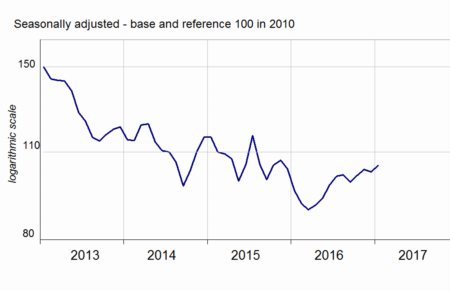
- Source: INSEE
Sharp increase in potatoes and fresh vegetables prices
In January 2017, potatoes prices remained much higher than their levels last year (+40.3%), as a consequence of the weak yields in North-West Europe during the last production campaign. Fresh vegetables prices surged too over one year (+38.6%) due to the significant decline in the winter productions (endive, leek, lamb's lettuce and lettuce). Fresh fruits prices remained very dynamic (+9.7% over one year). Wine prices increased by 1.3 over one year, driven by the growth in PDO wine prices.
graphiqueGraph2 – Producer prices of fresh vegetables
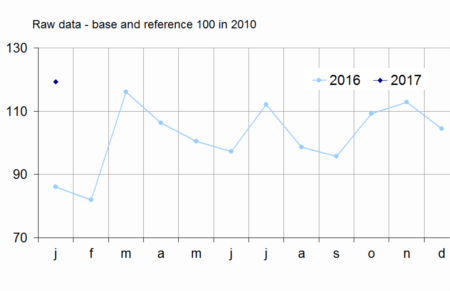
- Source: SSP (ministry in charge of agriculture)
Increase in animal and milk prices
Over one year animals prices kept on rising (+2.5%) owing to the buoyant pig price trend (+19.5% over one year), sustained by Chinese demand. Big catle prices kept on rallying (+3.5% over three months); however, they remained lower than a year before (−1.3%).
graphiqueGraph3 – Producer prices of pigs and large cattle
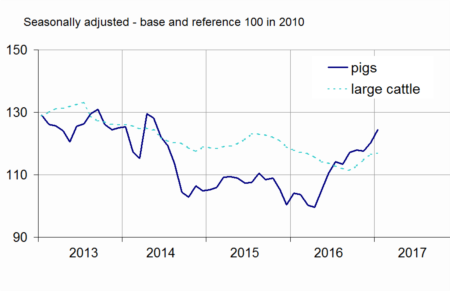
- Source: INSEE
Cow milk price continued to strengthen (+5.4% from October to December) owing to to strong Chinese demand while production declined in the main exporting zones (Southern America, Oceania and Europe).
tableauTableau1 – Indices of producer prices of agricultural products (IPPAP)
| Variation as % over | |||||
|---|---|---|---|---|---|
| Weights | Jan. 2017 | a month | 3 months | A year | |
| Agricultural goods output | 1000 | 119.7 | /// | /// | +8.4 |
| excluding fruits and vegetables | 900 | 120.0 | 0.0 | +2.5 | +7.0 |
| Crop output (excluding fruits and vegetables) | 505 | 123.7 | +0.2 | +1.5 | +8.0 |
| Cereals | 188 | 104.8 | +2.3 | +3.6 | +9.4 |
| of which soft wheat | 112 | 103.0 | +3.5 | +4.7 | +11.8 |
| grain maize | 41 | 101.8 | +1.6 | +3.6 | +12.1 |
| Potatoes | 26 | 252.4 | /// | /// | +40.3 |
| Wines | 177 | 133.1 | –1.8 | –1.7 | +1.3 |
| protected designation of origin | 84 | 143.8 | –2.8 | –2.3 | +3.9 |
| other wines | 23 | 136.5 | –1.5 | –3.1 | –6.2 |
| Oleaginous | 49 | 110.4 | +0.7 | +6.7 | +12.7 |
| Horticultural products | 30 | 111.8 | +0.2 | +0.9 | +2.8 |
| Other crop products | 36 | 111.7 | +1.2 | +2.3 | +2.3 |
| Fruits and vegetables (1) | 100 | 116.6 | /// | /// | +22.4 |
| Fresh vegetables | 53 | 119.3 | /// | /// | +38.6 |
| Fresh fruits | 35 | 114.2 | /// | /// | +9.7 |
| Animal output | 395 | 115.2 | –0.4 | +3.9 | +5.7 |
| Animals | 234 | 115.8 | +0.9 | +3.0 | +2.5 |
| of which large cattle | 96 | 116.8 | +0.3 | +3.5 | –1.3 |
| calves | 26 | 110.0 | +1.9 | +6.6 | –2.6 |
| pigs | 54 | 124.5 | +3.5 | +5.5 | +19.5 |
| sheep | 10 | 109.5 | –6.1 | –7.9 | –5.7 |
| poultry | 46 | 109.0 | 0.0 | –0.1 | –2.0 |
| of which chicken | 28 | 108.8 | –0.1 | +0.1 | –1.7 |
| Milk | 147 | 112.2 | /// | +5.0 | +9.7 |
| of which cow milk (2) | 137 | 112.2 | /// | +5.4 | +10.5 |
| Eggs | 15 | 135.7 | –17.3 | +5.4 | +19.3 |
- * Except for fresh fruits, fresh vegetables and potatoes
- /// Absence of result due to the nature of these series
- (1) Including vegetables for industry.
- (2)The December value of cow milk price indice is carried forward in January
- Sources: INSEE, SSP (ministry in charge of agriculture)
Continued rise in purchase prices of means of production
In January 2017, intermediate consumption prices kept on picking up (+0.4%), mostly driven by fertilisers prices. Over one year overall input prices rose by 0.2%: the higher price of energy (+22.4%) was virtually offset by the retreat in fertilisers (−9.6%) and feed prices (−1.9%). Capital goods prices were roughly stable this month (−0.1%) and went up by 1.1 % over one year.
Revisions
The level of IPPAP in December 2016 has been raised by 1.3 point noticeably further to the updating in seasonal series adjustments. IPAMPA has been revised by −0.4 point in relation with the revision of raw data.
graphiqueGraph4 – Purchase prices of the means of agricultural production
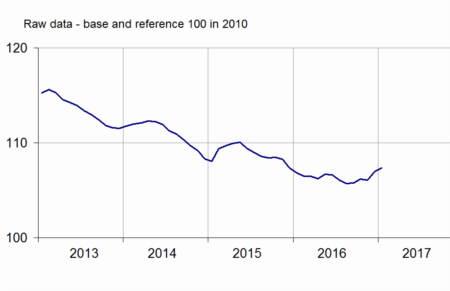
- Sources: INSEE, SSP (ministry in charge of agriculture)
tableauTableau2 – Indices of purchase prices of the means of agricultural production (IPAMPA)
| Weights | Jan. 2017 | variation as % over | |||
|---|---|---|---|---|---|
| a month | 3 months | a year | |||
| Total input | 1000 | 107.3 | +0.3 | +1.1 | +0.4 |
| Intermediate consumptions | 764 | 107.2 | +0.4 | +1.4 | +0.2 |
| Energy | 100 | 102.1 | +0.1 | +6.1 | +22.4 |
| Seeds | 57 | 106.4 | –0.1 | –0.9 | –2.0 |
| Fertilisers and soil improvers | 92 | 103.9 | +2.7 | +6.3 | –9.6 |
| Plant protection products | 78 | 97.8 | –0.9 | –1.7 | –0.8 |
| Animal feed | 205 | 112.8 | +0.5 | +0.7 | –1.9 |
| Veterinary expenses | 43 | 118.9 | +0.2 | +0.2 | +2.1 |
| Small equipment and tools | 17 | 104.8 | +0.1 | –3.7 | –4.4 |
| Maintenance of materials | 67 | 114.6 | +0.6 | +0.8 | +1.0 |
| Maintenance of buildings | 9 | 107.3 | 0.0 | +0.1 | +1.5 |
| Other goods and services | 97 | 102.0 | –0.1 | 0.0 | –1.2 |
| Goods and services contributing to investment | 236 | 107.7 | –0.1 | +0.2 | +1.1 |
| Material | 186 | 109.1 | –0.1 | +0.1 | +0.9 |
| Tractors | 79 | 109.6 | 0.0 | +0.2 | +1.1 |
| Machinery and equipment for cultivation | 36 | 110.6 | –0.2 | +0.3 | +0.4 |
| Machinery and equipment for harvesting | 42 | 109.9 | 0.0 | +0.1 | +1.6 |
| Utility vehicles | 18 | 104.1 | –1.0 | –0.5 | +0.1 |
| Buildings | 50 | 102.5 | 0.0 | +0.4 | +1.7 |
- (1) The repayment of the domestic tax on energy product (TICPE) benefiting farmers has been applied in advance for the year 2017
- Sources: INSEE, SSP (ministry in charge of agriculture)
.
Documentation
Methodology (pdf,122 Ko)
Pour en savoir plus
Time series : Indices of agricultural prices
