


 28 February 2017
2017- n° 53French GDP increased by 0.4% in Q4 2016 and by 1.1% over the year Quarterly national accounts - second estimate - fourth quarter 2016
28 February 2017
2017- n° 53French GDP increased by 0.4% in Q4 2016 and by 1.1% over the year Quarterly national accounts - second estimate - fourth quarter 2016
In Q4 2016, GDP in volume terms* accelerated: +0.4%, after +0.2% in Q3. On average over the year, GDP rose by 1.1%, practically as much as in 2015 (+1.2%). Without working day adjustment, GDP growth amounts to +1.2% in 2016, after +1.3% in 2015.
Household consumption expenditures accelerated in Q4 (+0.6% after +0.1%), as well as total gross fixed capital formation (GFCF; +0.4% after +0.2%). All in all, final domestic demand excluding inventory changes gathered momentum, contributing more to GDP growth: +0.5 points after +0.2 points.
Exports were more dynamic (+1.3% after +0.8%) while imports slowed down (+1.0% after +2.7%). All in all, foreign trade balance contributed slightly to GDP growth in Q4: +0.1 points after −0.6 points. Conversely, changes in inventories contributed negatively (−0.1 points after +0.7 points).

* This growth rate is seasonally and working-day adjusted; volumes are chain-linked previous-year-prices volumes.
graphiqueGraph – GDP and its main components
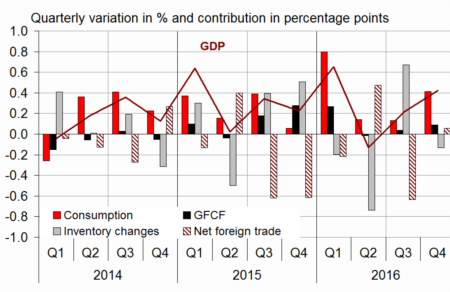
- Source: INSEE
tableauTab1 – Goods and services: supply and uses chain-linked volumes
| 2016 Q1 | 2016 Q2 | 2016 Q3 | 2016 Q4 | 2015 | 2016 | |
|---|---|---|---|---|---|---|
| GDP | 0.7 | -0.1 | 0.2 | 0.4 | 1.2 | 1.1 |
| Imports | 0.6 | -1.5 | 2.7 | 1.0 | 6.4 | 3.7 |
| Household consumption *expenditure | 1.3 | 0.1 | 0.1 | 0.6 | 1.5 | 1.8 |
| General government's *consumption expenditure | 0.4 | 0.4 | 0.3 | 0.4 | 1.4 | 1.5 |
| GFCF | 1.2 | -0.1 | 0.2 | 0.4 | 0.9 | 2.7 |
| *of which Non-financial corporated and unincorporated enterprises | 2.1 | -0.1 | -0.1 | 0.8 | 2.7 | 4.0 |
| Households | 0.6 | 0.5 | 0.7 | 0.7 | -0.8 | 2.0 |
| General government | -0.8 | -0.6 | 0.1 | -1.5 | -3.9 | -0.6 |
| Exports | -0.2 | 0.0 | 0.8 | 1.3 | 6.0 | 1.1 |
| Contributions : | ||||||
| Internal demand excluding inventory changes | 1.1 | 0.1 | 0.2 | 0.5 | 1.3 | 1.9 |
| Inventory changes | -0.2 | -0.7 | 0.7 | -0.1 | 0.2 | 0.0 |
| Net foreign trade | -0.2 | 0.5 | -0.6 | 0.1 | -0.3 | -0.8 |
- Source: Insee
Total production rose again
Total production in goods and services accelerated slightly in Q4 (+0.6% after +0.5%), thanks to a strong rebound in energy (+2.3% after −2.3%). It rose slightly more than in Q3 in manufacturing industry (+0.8% after +0.7%) and increased at the same pace in market services (+0.6%). By contrast, activity in construction decelerated (+0.2% after +0.9%).
On average over the year, total production increased a little more than in 2015 (+1.4% after +1.3%): it bounced back in construction (+0.7% after −2.2%) and accelerated in market services (+2.2% after +1.8%), but it slowed down in energy (+1.2% after +1.8%) and in the manufacturing industry (+0.6% after +1.5%). Agricultural production decreased sharply (−5.7% after −2.2%), due to adverse weather conditions.
Household consumption recovered
Household consumption accelerated in Q4 2016 (+0.6% after +0.1%). Expenditure in engineered goods bounced back (+0.9% after −1.1%), particularly in cars. Energy consumption accelerated sharply (+3.7% after −1.5%), mainly due to gas and electricity, because temperatures were below the seasonal norms. However, services consumption slowed a little (+0.3% after +0.5%).
On average over the year, household consumption rose more in 2016 than in 2015 (+1.8% after +1.5%), notably buoyed by household expenditure in home equipment in the first half of 2016.
Corporate investment picked up sharply at the end of 2016
In Q4, total GFCF accelerated slightly (+0.4% after +0.2%), because of non-financial corporations. Investment in manufactured goods rebounded sharply (+1.3% after −2.4%), mainly in transport equipment. However, investment in market services slowed down (+0.3% after +1.3%), as that in construction (0.0% after +0.6%), notably due to the decrease in civil engineering.
Over the whole of 2016, total GFCF accelerated sharply: +2.7% after +0.9%.
Foreign trade balance stimulated GDP growth at the end of 2016 but weighed down on it on average in 2016
In Q4, exports accelerated (+1.3% after +0.8%), notably in transport equipment. In the same time, imports decelerated (+1.0% after +2.7%). In particular, raw hydrocarbons and manufactured goods purchases slowed sharply. All in all, external exchanges provided a slightly positive contribution to GDP growth: +0.1 points after −0.6 points.
On average over the year 2016, imports slowed down (+3.7% after +6.4%), but much less than exports (+1.1% after +6.0%). Consequently, foreign trade balance contributed more negatively to GDP growth in 2016 than in 2015 (−0.8 points after −0.3 points).
The contribution of inventory changes was slightly negative in Q4
In Q4 2016, the contribution of changes in inventories to GDP growth was −0.1 points (after +0.7 points), mainly due to “other industrial products” (pharmacy and steel products notably).
Over the year, the contribution of changes in inventories to GDP growth was neutral, after +0.2 points in 2015.
tableauTab3 – Production, consumption and GFCF: main components
| 2016 Q1 | 2016 Q2 | 2016 Q3 | 2016 Q4 | 2015 | 2016 | |
|---|---|---|---|---|---|---|
| Production of branches | 0.7 | -0.2 | 0.5 | 0.6 | 1.3 | 1.4 |
| Goods | 0.2 | -0.7 | 0.1 | 1.0 | 1.2 | 0.1 |
| Manufactured Industry | 0.3 | -1.0 | 0.7 | 0.8 | 1.5 | 0.6 |
| Construction | 0.4 | -0.3 | 0.9 | 0.2 | -2.2 | 0.7 |
| Market services | 1.1 | -0.1 | 0.6 | 0.6 | 1.8 | 2.2 |
| Non-market services | 0.4 | 0.3 | 0.3 | 0.3 | 1.0 | 1.3 |
| Household consumption | 1.3 | 0.1 | 0.1 | 0.6 | 1.5 | 1.8 |
| Food products | 0.4 | -0.6 | 0.8 | -0.4 | 1.2 | 0.7 |
| Energy | 2.3 | 1.8 | -1.5 | 3.7 | 1.4 | 1.8 |
| Engineered goods | 2.3 | 0.3 | -1.1 | 0.9 | 2.6 | 2.5 |
| Services | 0.9 | -0.2 | 0.5 | 0.3 | 1.0 | 1.5 |
| GFCF | 1.2 | -0.1 | 0.2 | 0.4 | 0.9 | 2.7 |
| Manufactured goods | 2.5 | -0.1 | -2.4 | 1.3 | 2.1 | 5.5 |
| Construction | 0.5 | -0.1 | 0.6 | 0.0 | -2.2 | 0.8 |
| Market services | 1.4 | 0.1 | 1.3 | 0.3 | 4.4 | 3.5 |
- Source: INSEE
tableauTab2 – Sectoral accounts
| 2016 Q1 | 2016 Q2 | 2016 Q3 | 2016 Q4 | 2015 | 2016 (ovhg) | |
|---|---|---|---|---|---|---|
| Profit ratio of NFC* (level) | 32.0 | 31.6 | 31.6 | 31.4 | ||
| Household purchasing power | 0.6 | 0.3 | 0.7 | 1.6 | 1.9 |
- *NFC: non-financial corporations
- Source: INSEE
tableauTab4 – Households' disposable income and ratios of households' account
| 2016 Q1 | 2016 Q2 | 2016 Q3 | 2016 Q4 | 2015 | 2016 (ovhg) | |
|---|---|---|---|---|---|---|
| HDI | 0.5 | 0.3 | 0.8 | 1.4 | 1.9 | |
| Household purchasing power | 0.6 | 0.3 | 0.7 | 1.6 | 1.9 | |
| HDI by cu* (purchasing power) | 0.5 | 0.2 | 0.6 | 1.2 | 1.5 | |
| Adjusted HDI (purchasing power) | 0.6 | 0.3 | 0.6 | 1.6 | 1.8 | |
| Saving rate (level) | 14.3 | 14.5 | 15.0 | 14.5 | ||
| Financial saving rate (level) | 5.5 | 5.4 | 5.9 | 5.5 |
- *cu: consumption unit
- Source: INSEE
tableauTab5 – Ratios of non-financial corporations' account
| 2016 Q1 | 2016 Q2 | 2016 Q3 | 2016 Q4 | 2015 | |
|---|---|---|---|---|---|
| Profit share | 32.0 | 31.6 | 31.6 | 31.4 | |
| Investment ratio | 23.3 | 23.4 | 23.3 | 22.9 | |
| Savings ratio | 21.2 | 20.7 | 20.7 | 19.7 | |
| Self-financing ratio | 91.1 | 88.2 | 88.9 | 86.3 |
- Source: INSEE
tableauTab6 – Expenditure, receipts and net borrowing of public administrations
| 2016 Q1 | 2016 Q2 | 2016 Q3 | 2016 Q4 | 2015 | |
|---|---|---|---|---|---|
| In billions of euros | |||||
| Total expenditure | 313.1 | 314.8 | 317.1 | 1242.8 | |
| Total receipts | 295.0 | 296.1 | 295.8 | 1166.3 | |
| Net lending (+) or borrowing (-) | -18.1 | -18.8 | -21.3 | -76.5 | |
| In % of GDP | |||||
| Net lending (+) or borrowing (-) | -3.3 | -3.4 | -3.8 | -3.5 |
- Source: INSEE
Revisions
The estimate of GDP growth in Q4 2016 is confirmed at +0.4%. Slight revisions in different aggregates offset each other; they are mainly due to the integration of new indicators and to the update of seasonal adjustment coefficients.
Pour en savoir plus
Time series : Operations on goods and services
Time series : Gross domestic product balance
Time series : Institutional sector accounts
Time series : Branch accounts
