


 23 February 2017
2017- n° 48In February 2017, the business climate remains favourable in services Monthly survey of services - February 2017
23 February 2017
2017- n° 48In February 2017, the business climate remains favourable in services Monthly survey of services - February 2017
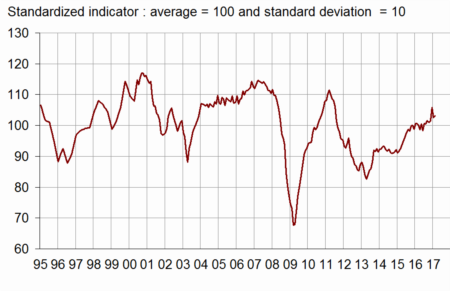
According to business managers surveyed in February 2017, the business climate in services remains favourable. The business climate composite indicator is stable and stands at 103, above its long-term average (100). Because of late businesses' answers that have been taken into account, the indicator in January has been revised upward by one point.
- Business and demand prospects are steady or almost
- Near stability of the road transport business climate
- In accommodation and food services, the business climate has returned to its long-term average
- The business climate remains at its long-term average in information and communication
- The business climate in real estate activities has declined
- In professional, scientific and technical activities, the business climate has recovered
- The business climate remains favourable in administrative and support service activities
According to business managers surveyed in February 2017, the business climate in services remains favourable. The business climate composite indicator is stable and stands at 103, above its long-term average (100). Because of late businesses' answers that have been taken into account, the indicator in January has been revised upward by one point.
graphiqueGraph1 – Business climate composite indicator
The turning point indicator has returned into the area indicating a favourable short-term outlook.
graphiqueGraph2 – Turning point indicator
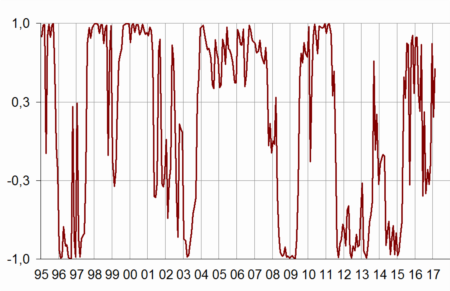
- Note: close to 1 (respectively −1), this indicator indicates a favourable short-term economic situation (respectively unfavourable). Between +0.3 and −0.3: uncertainty area.
Business and demand prospects are steady or almost
The balance on general outlook, which relates the assessment of business leaders over their whole sector, is virtually stable, clearly above its long-term average. The balances of opinion on past and expected activity and on expected demand are steady or almost steady. Among them, only the balance on expected activity stays slightly below its long-term average.
The balances on past and expected employment are unchanged and remain clearly above their long-term average. However, the balances on employment for service businesses except temporary work agencies have decreased slightly.
The balance on past selling prices is virtually stable, below its long-term average. Nevertheless, more business leaders than last month plan increase their selling prices in the coming months. The corresponding balance has increased and returned to its long-term average.
The balance on past investments is almost steady, whereas that on expected investments has edged down. Both balances remain above their long-term average.
tableauTable1 – Economic outlook in the services sector
| Average* | Nov. 16 | Dec. 16 | Jan. 17 | Feb. 17 | |
|---|---|---|---|---|---|
| Composite indicator | 100 | 102 | 106 | 103 | 103 |
| General outlook | –8 | –6 | –1 | –3 | –2 |
| Past activity | 2 | 0 | 5 | 4 | 4 |
| Expected activity | 2 | 1 | 5 | 0 | 0 |
| Expected demand | –1 | 2 | 6 | 0 | 1 |
| Past selling prices | –4 | –3 | –4 | –6 | –7 |
| Expected selling prices | –3 | –8 | –5 | –8 | –3 |
| Past employment | 3 | 5 | 10 | 13 | 13 |
| except temporary work agencies | 1 | 2 | 6 | 5 | 3 |
| Expected employment | 2 | 11 | 11 | 10 | 10 |
| except temporary work agencies | –1 | 5 | 4 | 4 | 2 |
| Investments | |||||
| Past investments | 2 | 5 | 8 | 6 | 7 |
| Expected investments | 1 | 5 | 6 | 8 | 6 |
- * Average since 1989 for the composite indicator and since 1988 for the balances of opinion
- Source: INSEE, monthly business survey in services.
In most subsectors, the business climate is virtually stable. However, it has declined in real estate activities, whereas it has improved in professional, scientific and technical activities.
Near stability of the road transport business climate
In road transport, the business climate is practically stable. At 108, it stands clearly above its long-term average. The balances on activity have improved. However, the expectations on demand have decreased. All balances remain clearly above their long-term average.
In accommodation and food services, the business climate has returned to its long-term average
In accommodation and food services, the business climate has improved slightly, returning to its long-term average. The balances on activity have decreased and come back slightly below their long-term average, but the balances on expected demand and on general outlook have gone up.
The business climate remains at its long-term average in information and communication
In information and communication, the business climate remains at its long-term average (100). The decrease of the balances on past activity and employment is offset by the increase of the balances on expected activity and employment.
The business climate in real estate activities has declined
In real estate activities, the business climate has gone down by three points, sliding slightly below its long-term average (99). The balances on expected activity, demand and employment have decreased.
In professional, scientific and technical activities, the business climate has recovered
The business climate in professional, scientific and technical activities has gone up by 2 points. At 104, it stands above its long-term average. The balance on general outlook has improved, exceeding more its long-term average.
The business climate remains favourable in administrative and support service activities
In administrative and support service activities, the business climate is unchanged. At 106, it stands clearly above its long-term average. The balances on past activity and employment have improved. All balances are much higher than their long-term average, particularly those on employment.
tableauTable2 – Business climate composite indicator and balances of opinion by sub-sector in services
| Aggregated classification (NA 2008) at level A21 | Mean* | Nov. 16 | Dec. 16 | Jan. 17 | Feb. 17 |
|---|---|---|---|---|---|
| Road transport (8%) | |||||
| Composite indicator | 100 | 104 | 108 | 107 | 108 |
| Past activity | –8 | –11 | –6 | –3 | 1 |
| Expected activity | –9 | –8 | 2 | 0 | 5 |
| Expected demand | –12 | –3 | 2 | 2 | –3 |
| Past employment | –7 | 1 | 4 | 5 | 3 |
| Expected employment | –10 | 1 | 9 | 2 | 4 |
| General outlook | –23 | –8 | –8 | –6 | –8 |
| Accommodation and food service activities (11%) | |||||
| Composite indicator | 100 | 102 | 104 | 99 | 100 |
| Past activity | –7 | –11 | –8 | –6 | –9 |
| Expected activity | –8 | –8 | –5 | –6 | –9 |
| Expected demand | –10 | –2 | –5 | –12 | –10 |
| Past employment | –4 | –7 | 0 | –1 | –3 |
| Expected employment | –6 | 8 | 0 | –5 | –8 |
| General outlook | –14 | –15 | –9 | –16 | –11 |
| Information and communication (24%) | |||||
| Composite indicator | 100 | 102 | 103 | 100 | 100 |
| Past activity | 8 | 7 | 12 | 0 | –2 |
| Expected activity | 9 | 4 | 8 | –3 | 1 |
| Expected demand | 10 | 13 | 15 | 1 | 1 |
| Past employment | 6 | 17 | 17 | 23 | 13 |
| Expected employment | 10 | 13 | 10 | 11 | 14 |
| General outlook | 0 | –1 | –1 | –1 | –2 |
| Real estate activities (13%) | |||||
| Composite indicator | 100 | 102 | 105 | 102 | 99 |
| Past activity | 7 | 8 | 17 | 9 | 8 |
| Expected activity | 8 | 8 | 9 | 8 | 3 |
| Expected demand | 1 | 3 | 8 | 5 | 3 |
| Past employment | 3 | 8 | 7 | 4 | 9 |
| Expected employment | 2 | 6 | 2 | 13 | 7 |
| General outlook | –2 | 1 | 6 | 4 | 6 |
| Professional, scientific and technical activities (24%) | |||||
| Composite indicator | 100 | 101 | 105 | 102 | 104 |
| Past activity | –1 | –1 | 0 | 4 | 4 |
| Expected activity | –2 | –3 | 1 | –6 | –5 |
| Expected demand | –6 | –4 | –2 | –2 | 0 |
| Past employment | 1 | 3 | 8 | 10 | 10 |
| Expected employment | 0 | 5 | 6 | 7 | 7 |
| General outlook | –9 | –6 | –2 | –4 | –1 |
| Administrative and support service activities (18%) | |||||
| Composite indicator | 100 | 100 | 107 | 106 | 106 |
| Past activity | 6 | –3 | 7 | 15 | 19 |
| Expected activity | 5 | 7 | 12 | 9 | 9 |
| Expected demand | 3 | 1 | 12 | 9 | 7 |
| Past employment | 9 | 9 | 18 | 23 | 27 |
| Expected employment | 7 | 19 | 22 | 20 | 20 |
| General outlook | –5 | –3 | 3 | 2 | 3 |
- The figures in parentheses indicate the weights used to aggregate the sub-sector balances of opinion.
- *Composite indicators: average since 1989 (2006 for road transport); balances of opinion: average since 1988 (2006 for road transport)
- Source : INSEE, monthly business survey in services.
Documentation
Abbreviated Methodology (2017) (pdf,177 Ko)
Pour en savoir plus
Time series : Economic outlook surveys – Services
