


 23 February 2017
2017- n° 47In February 2017, the economic climate is stable in the building construction industry Monthly survey of building - February 2017
23 February 2017
2017- n° 47In February 2017, the economic climate is stable in the building construction industry Monthly survey of building - February 2017
According to the business managers in the building construction industry surveyed in February 2017, the business climate is stable. The composite indicator stands at 99, a shade below its long-term average (100).
According to the business managers in the building construction industry surveyed in February 2017, the business climate is stable. The composite indicator stands at 99, a shade below its long-term average (100).
graphiqueGraph1 – Business climate composite indicator

The turning point indicator remains in the favourable outlook zone.
graphiqueGraph2 – Turning-point indicator
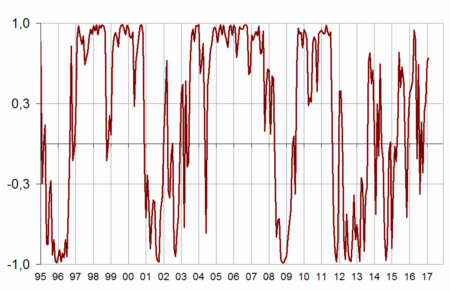
- Note: close to 1 (respectively −1), it indicates a favourable climate (respectively unfavourable). Between +0,3 and −0,3: uncertainty area
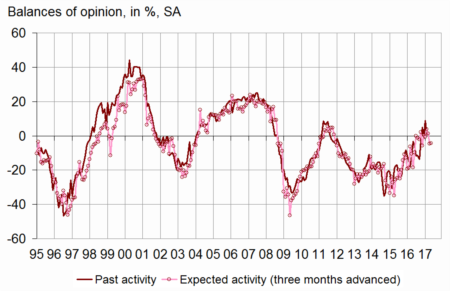
Business managers' opinion about their past activity has fallen back
In February 2017, far fewer business managers than in January have indicated an increase in their past activity. The corresponding balance has fallen back, after having reached in January its highest level since July 2011. It remains however well above its long-term average. The balance of opinion on expected activity is virtually stable, slightly above its long-term average level.
graphiqueGraph3 – Activity tendency in building construction
tableauTable1 – Building industry economic outlook
| Mean* | Nov. 16 | Dec. 16 | Jan. 17 | Feb. 17 | |
|---|---|---|---|---|---|
| Composite indicator | 100 | 99 | 98 | 99 | 99 |
| Past activity | –4 | 5 | –2 | 9 | 1 |
| Expected activity | –6 | 4 | 1 | –5 | –4 |
| Gen. business outlook | –19 | 0 | |||
| Past employment | –6 | –17 | –16 | –15 | –11 |
| Expected employment | –5 | –14 | –8 | –7 | –10 |
| Opinion on order books | –24 | –34 | –39 | –31 | –32 |
| Order books (in month) | 5.5 | 6.8 | 6.8 | 6.8 | 6.9 |
| Production capacity utilisation rate | 88.4 | 87.2 | 86.9 | 87.1 | 87.1 |
| Obstacles to production increase (in %) | 32 | 25 | 25 | 25 | 26 |
| - Because of workforce shortage (in %) | 13.9 | 4.9 | 4.9 | 5.1 | 5.3 |
| Recruiting problems (in %) | 57 | 48 | |||
| Expected prices | –15 | –20 | –19 | –13 | –14 |
| Cash-flow position | –10 | –21 | |||
| Repayment period | 30 | 33 |
- * Mean since September 1993.
- Source: INSEE, French business survey in the building industry
Fewer business managers indicate a cut in past employment
In February 2017, fewer business managers than in January have indicated a drop in their staff size over the last three months. The corresponding balance has risen by 10 points since October 2016 but remains below its long-term average. Conversely, the balance of opinion on expected staff size has decreased and has deviated from its long-term average.
graphiqueGraph4 – Workforce size tendency in building construction

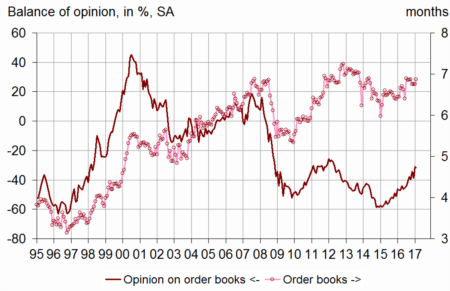
Order books remain judged poorly filled
As many business managers as in January consider that their order books are poorly filled for the period. The corresponding balance remains well below its long-term average. With their present staff size, business managers consider that their order books provide 6.9 months of work, a level slightly higher than last month and well above its long-term average (5.4 months).
graphiqueGraph5 – Order books
Production capacity remains weakly used
After having recovered for a year and a half, the production capacity utilisation rate has been virtually stable since August 2016, hovering around 87%. In February, it is stable at 87.1%. It has been below its long-term average (88.4%) since January 2012. Only one business manager out of four has reported difficulties in increasing output, compared to one out of three in average since 1993.
graphiqueGraph6 – Production capacity utilisation rate

Prices prospects close to normal
In February 2017, almost as many business managers as in January have announced that they were going to increase their prices during the next three months. The corresponding balance has hit in January its highest level since August 2011, and stands a shade above its long-term average.
Documentation
Abbreviated Methodology (2017) (pdf,176 Ko)
Pour en savoir plus
