


 25 January 2017
2017- n° 16In the Q4 2016, production capacity is more used in the manufacturing industry Quarterly business survey (goods-producing industries) - January 2017
25 January 2017
2017- n° 16In the Q4 2016, production capacity is more used in the manufacturing industry Quarterly business survey (goods-producing industries) - January 2017
In January 2017, the industrialists have reported that they used more their machinery and equipment. The production capacity utilisation rate has increased by 0.8 points compared to the previous quarter. Production capacity is anew more used in the manufacturing industry than it was on average between 1995 and 2007.
Almost as many industrialists as in the previous quarter consider that they could produce more if they received more orders: the balance on production bottlenecks is virtually stable, above normal. The proportion of industrialists indicating difficulties of supply remains close to normal and that of industrialists reporting difficulties of demand only remains below its long-term average.

Warning: as from January 2017, the quarterly questionnaire of the business survey in industry has been slightly modified in order to reduce the statistical response burden on enterprises (see methodological note).
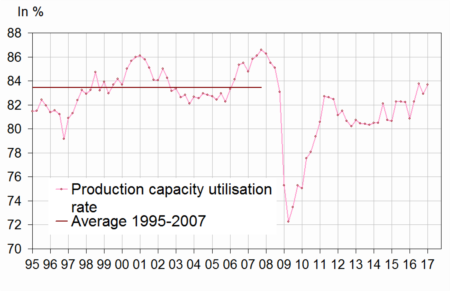
Increased use of production capacity
In January 2017, the industrialists have reported that they used more their machinery and equipment. The production capacity utilisation rate has increased by 0.8 points compared to the previous quarter. Production capacity is anew more used in the manufacturing industry than it was on average between 1995 and 2007.
Almost as many industrialists as in the previous quarter consider that they could produce more if they received more orders: the balance on production bottlenecks is virtually stable, above normal. The proportion of industrialists indicating difficulties of supply remains close to normal and that of industrialists reporting difficulties of demand only remains below its long-term average.
graphiqueGraph 1 – Production capacity utilisation rate
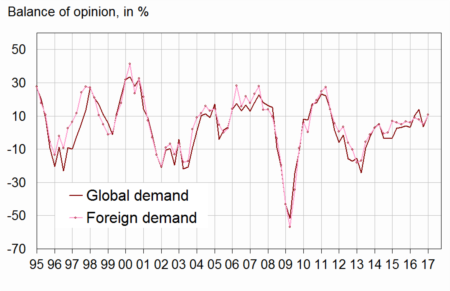
The balance of opinion on past demand has rebounded
Compared to the previous quarter, more industrialists judge that global and foreign demand increased in the past months. The corresponding balances are above their mean level. Industrialists are roughly as upbeat as in the previous quarter on global and foreign demand over the next three months; the corresponding balances of opinion are above average.
graphiqueGraph 2 – Balance of opinion of past change in demand
tableauTable 1 – Industrialists' opinion: demand and production factors
| Manufacturing industry | Mean | April 16 | July 16 | Oct. 16 | Jan. 17 |
|---|---|---|---|---|---|
| Global demand | |||||
| Past change | 0 | 10 | 14 | 3 | 11 |
| Future change | 1 | 5 | 5 | 8 | 8 |
| Foreign demand | |||||
| Past change | 2 | 9 | 8 | 4 | 11 |
| Future change | 4 | 8 | 5 | 7 | 9 |
| Production factors | |||||
| Production bottlenecks (in %) | 22 | 25 | 26 | 27 | 28 |
| Assessment of productive capacity | 14 | 8 | 11 | 12 | 7 |
| Production capacity utilisation rate (in %) | 82,9 | 82,3 | 83,8 | 82,9 | 83,7 |
| Difficulties of supply and demand (in %) | |||||
| Difficulties of supply and demand | 8 | 9 | 7 | 10 | 9 |
| Difficulties of supply only | 20 | 14 | 18 | 18 | 19 |
| Difficulties of demand only | 44 | 39 | 39 | 36 | 35 |
- * : Long-term average since 1976, except for questions on difficulties of supply and demand.
- The results of the last survey are preliminary.
- Source: INSEE - Quarterly business survey in industry
Fewer industrialists report recent staff cuts
In January 2017, fewer industrialists than in October have reported that they reduced workforce in the past three months. However, over the next few months, more industrialists than in the previous quarter forecast job losses. Both balances have remained above their long-term average since October 2013.
One out of four industrialists have experienced hiring difficulties; this part has dramatically decreased in January and is now just below its long-term average.
graphiqueGraph 3 – Workforce size in the manufacturing industry
Past increased in selling prices
According to industrialists, selling prices in the manufacturing industry have increased in Q4 2016 (+0.2%), for the first time since two years. Business managers forecast a further increase in Q1 2017 (+0.3%).
Almost as many industrialists as in the previous quarter have experienced cash-flow problems (11%). This proportion stands below its mean level (14%).
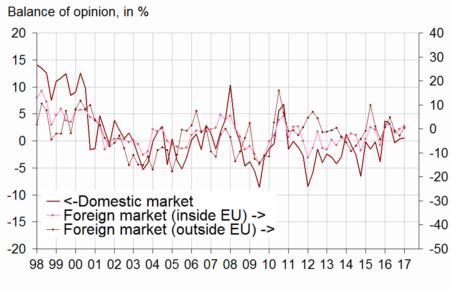
General exportation expectations have surged
In January 2017, the industrialists' opinion on their competitive position on domestic market or on foreign markets inside EU is almost unchanged. However, that on competitive position outside EU has slightly increased. These three balances are close to their long-term average. Nevertheless, industrialists are much more upbeat than in October on general exportation prospects: the corresponding balance has reached its highest level since Q3 2015, significantly above normal.
graphiqueGraph 4 – Competitive position
tableauTable 2 – Industrialists' opinion: employment, competitive position, cash-flow and selling prices
| Manufacturing industry | Mean | April 16 | July 16 | Oct. 16 | Jan. 17 |
|---|---|---|---|---|---|
| Workforce size | |||||
| Past change | –11 | –4 | –8 | –5 | –1 |
| Expected change | –12 | –6 | –7 | –1 | –3 |
| Difficulties hiring (in %) | 28 | 30 | 31 | 34 | 27 |
| Selling prices and cash-flow | |||||
| Past change on selling prices | 0,1 | –0,6 | –0,2 | –0,1 | 0,2 |
| Expected change on selling prices | 0,2 | –0,1 | –0,1 | 0,2 | 0,3 |
| Cash-flow problems (in %) | 14 | 12 | 11 | 11 | 11 |
| Competitive position | |||||
| On domestic market | 1 | 3 | 0 | 0 | 1 |
| On foreign markets inside EU | –2 | 2 | –1 | 0 | 1 |
| On foreign markets outside EU | –2 | 5 | –1 | –3 | 0 |
| General exportation expectations | –10 | –7 | –1 | 0 | 6 |
- * : Long-term average since 1991, except for workforce change (since 1976) and for competitive position by market (since 1997).
- The results of the last survey are preliminary.
- A quantitative question is asked about selling prices.
- Nota bene: questions on past and expected change on working time and on past wages have been discontinued. However, those information are available in the DARES Labour Activity and Employment Conditions (ACEMO) survey.
- Source: INSEE - Quarterly business survey in industry
Documentation
Abbreviated methodology (pdf,174 Ko)
Pour en savoir plus
Time series : Industry
