


 25 January 2017
2017- n° 15In January 2017, the business climate in manufacturing holds steady well above normal Monthly business survey (goods-producing industries) - January 2017
25 January 2017
2017- n° 15In January 2017, the business climate in manufacturing holds steady well above normal Monthly business survey (goods-producing industries) - January 2017
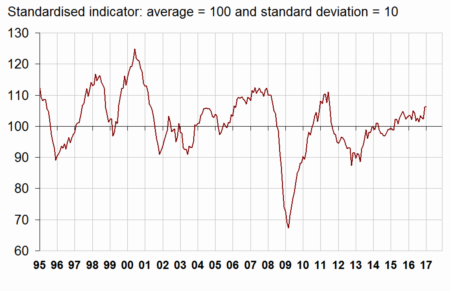
According to the business managers surveyed in January 2017, the business climate in industry holds steady at 106. It stands at its highest level since August 2011, significantly above its long-term average (100).
- Growing optimism of the industrialists about production expectations
- In the manufacture of food products and beverages, the business climate is less favourable
- In the manufacture of machinery and equipment goods, the business climate has reached its highest level since July 2011
- The business climate has slightly improved in the manufacture of transport equipment
- The business climate has climbed again in “other manufacturing”
According to the business managers surveyed in January 2017, the business climate in industry holds steady at 106. It stands at its highest level since August 2011, significantly above its long-term average (100).
graphiqueGraph 1 – Business climate in industry - Composite indicator
The turning-point indicator remains in the zone indicating a further favourable economic outlook.
graphiqueGraph 2 – Turning-point indicator
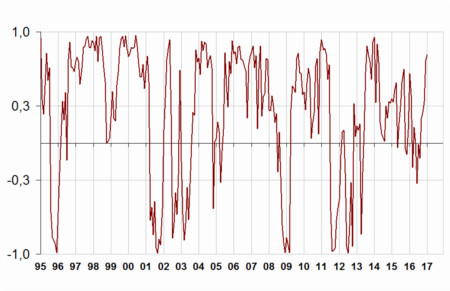
- How to read it: close to 1 (respectively −1), the indicator points to a favourable short-term economic situation (respectively unfavourable). Between −0.3 and +0.3: uncertainty area.
Growing optimism of the industrialists about production expectations
In January 2017, the balance of opinion on past activity, has fallen back albeit remaining significantly above normal. That on personal production expectations, already above its mean in December, has improved further.
Business managers are increasingly upbeat on general production prospects for the sector. The corresponding balance, above its long-term average since February 2015, has climbed slightly again.
In January, while the balance on export order books has increased again and has reached its highest level since July 2011, that on global order books is virtually stable, above normal.
Finally, more industrialists than in December consider that finished-goods inventories are below normal: the corresponding balance, already below its long-term average, has slightly fallen back.
tableauTable 1 – Industrialists' opinion on manufacturing activity
| Manufacturing industry | Ave.* | Oct. 16 | Nov. 16 | Dec. 16 | Jan. 17 |
|---|---|---|---|---|---|
| Composite indicator | 100 | 103 | 102 | 106 | 106 |
| Past activity | 4 | 7 | 8 | 19 | 12 |
| Finished-goods inventory | 13 | 10 | 7 | 8 | 6 |
| Global order books | –18 | –15 | –16 | –10 | –11 |
| Export order books | –14 | –11 | –11 | –9 | –4 |
| Personal production expectations | 5 | 9 | 5 | 8 | 11 |
| General production expectations | –9 | 1 | 3 | 6 | 8 |
- * Long-term average since 1976.
- Source: INSEE - Monthly business tendency survey in industry
The stability in the business climate in industry is the result of a decreased in the manufacture of food products and beverages offset by an improvement in that of machinery and equipment goods, in the manufacture of transport equipment and in “other manufacturing”. No sub-sector is below its long-term average anymore.
In the manufacture of food products and beverages, the business climate is less favourable
In the manufacture of food products and beverages, the business climate has decreased by four points in January but remains significantly above its long-term average. This decline mainly comes from a decrease in the balances of opinion on order books, partly offset by an upturn of than on past activity.
In the manufacture of machinery and equipment goods, the business climate has reached its highest level since July 2011
In the manufacture of machinery and equipment goods, the business climate has increased by one point, hitting its highest level since July 2011, above normal. This improvement mainly stems from the balance on export order books.
In electrical equipment, the business climate has further increased and has reached its highest level since August 2011, above normal. It is virtually stable significantly above its mean level in the computer, electronic and optical product industry. However, in machinery and equipment, the business climate has slightly deteriorated albeit remaining above its mean.
The business climate has slightly improved in the manufacture of transport equipment
In the manufacture of transport equipment, the business climate, already significantly above normal in December, has gained one point. Specifically, the balance on export order books has recovered to a level close to its October's level.
The business climate has improved again in the manufacture of motor vehicles, trailers and semi-trailers and has well exceeded its long-term average. However, it is virtually stable above normal in other transport equipment.
The business climate has climbed again in “other manufacturing”
In overall “other manufacturing”, the business climate has gained one point and has reached its highest level since July 2011, significantly above normal. Specifically, the balances on past activity and on global order books have increased again.
The business climate, already above normal in December, has improved further in wood-paper, chemicals and basic metals. In the “other manufacturing industries” it has reached the normal level. It is unchanged in rubber and plastic products, significantly above normal. However, in clothing-textiles, the business climate has fallen back albeit remaining far above normal.
graphiqueGraph 3 – Business climates in a sector-based approach
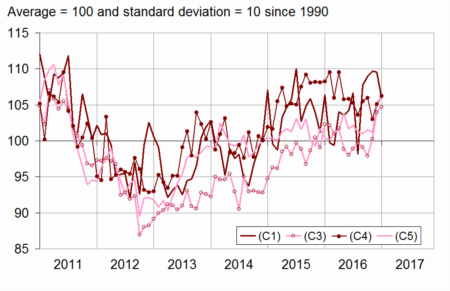
- Legend: (C1): Food products and beverages - (C3): Machinery and equipment goods - (C4): Manufacture of transport equipment - (C5): Other manufacturing
tableauTable 2 – Business climates in a sector-based approach
| NA* : (A17) et [A38 et A64] | Weights** (%) | Nov. 16 | Dec. 16 | Jan. 17 |
|---|---|---|---|---|
| (C1) Food products and beverages | 21 | 110 | 110 | 106 |
| (C3) Machinery and equipment goods | 11 | 100 | 104 | 105 |
| [CI] Computer, electronic and optical products | 3 | 105 | 111 | 110 |
| [CJ] Electrical equipment | 3 | 98 | 100 | 103 |
| [CK] Machinery and equipment | 5 | 100 | 103 | 101 |
| (C4) Man. of transport equipment | 15 | 103 | 105 | 106 |
| [CL1] Motor vehicles, trailers and semi-trailers | 7 | 101 | 104 | 108 |
| [CL2] Other transport equipment | 8 | 104 | 104 | 103 |
| (C5) Other manufacturing | 46 | 101 | 105 | 106 |
| [CB] Textiles, clothing industries, leather and footwear industry | 2 | 110 | 112 | 108 |
| [CC] Wood, paper, printing | 5 | 99 | 104 | 105 |
| [CE] Chemicals and chemical products | 9 | 101 | 103 | 106 |
| [CG] Rubber and plastic products | 7 | 102 | 106 | 106 |
| [CH] Basic metals and fabricated metal products | 11 | 100 | 104 | 105 |
| [CM] Other manufacturing industries | 9 | 98 | 99 | 100 |
- * NA: aggregated classification, based on the French classification of activities NAF rév.2.
- ** Weights used to aggregate sub-sector's balances of opinion.
- Source: INSEE - Monthly business tendency survey in industry
Documentation
Methodology (pdf,133 Ko)
Pour en savoir plus
Time series : Industry - Activity and demand
