


 18 January 2017
2017- n° 13In December 2016, oil prices soared Prices of oil and raw material imports - December 2016
18 January 2017
2017- n° 13In December 2016, oil prices soared Prices of oil and raw material imports - December 2016
In December 2016, the price of crude oil in euros soared (+19.1% after −4.6%). It reached an average of €51.1 per barrel, hitting its higher level since july 2015. The prices in euros of all other imported commodities rose less sharply (+2.9% after +6.4% in November) due to a slowdown in industrial raw materials prices (+3.5% after +10.0%). Furthermore, the prices of raw food materials kept recovering (+1.8% after +0.5%).
In December 2016, the price of crude oil in euros soared (+19.1% after −4.6%). It reached an average of €51.1 per barrel, hitting its higher level since july 2015. The prices in euros of all other imported commodities rose less sharply (+2.9% after +6.4% in November) due to a slowdown in industrial raw materials prices (+3.5% after +10.0%). Furthermore, the prices of raw food materials kept recovering (+1.8% after +0.5%).
Oil price bounced back sharply
In December, the price of North Sea crude oil (Brent) in euros bounced back sharply (+19.1% after −4.6%), boosted by the OPEC agreement to reduce production. In dollars, the rise in oil price is somewhat less pronounced (+16.4% after −6.6%) because the euro depreciated again during the month.
graphiqueGraph1 – Oil (Brent)
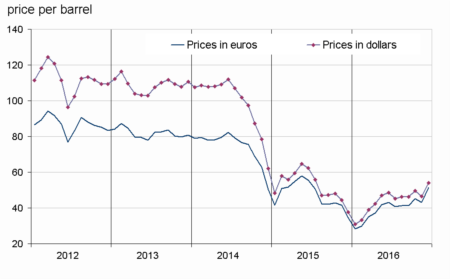
- Source: INSEE
tableauTable1 – Oil and petroleum products
| Prices | Change (%) | |||
|---|---|---|---|---|
| of last month | over the last month | over the last 3 months | over the last 12 months | |
| Brent in $ per barrel | 54.1 | 16.4 | 17.1 | 43.3 |
| Brent in € per barrel | 51.3 | 19.1 | 24.5 | 48.1 |
| Gasoline €/L | 0.410 | 14.3 | 21.0 | 42.5 |
| Gas Oil | 459.2 | 15.9 | 23.0 | 41.6 |
| Heavy fuel | 321.7 | 21.7 | 30.4 | 100.1 |
| Naphtha | 436.4 | 13.1 | 25.0 | 21.7 |
- Prices are in euros per tonne unless otherwise specified
- Source : INSEE
Industrial commodity prices slowed
The prices in euros of industrial raw materials grew less than in November (+3.5% after +10.0%). Minerals prices slowed (+3.5% after +12.2%). The price of iron ore rose less significantly than in November (+12.9% after +27.3%) and the increase in non-ferrous metals prices eased (+1.0% after +9.6%). In addition, the prices of precious metals fell back (−4.0% after +1.3%), especially gold prices (−4.7% after +0.3%) because the rise in base interest rates in United States has lessened the attractiveness of gold. In contrast, the prices of agricultural raw materials gathered pace (+5.2% after +1.9%), driven again by a sharp increase in rubber (+13.6% after +10.4%) that benefited from the recovery in oil prices and the increase of vehicle sales in China. Moreover, the price of wood pulp grew again, and the price of sawn softwood bounced back. Only the price of hides edged down (−0.2% after +4.8%).
Raw food material prices expanded again
In euros, the prices of raw food materials went up more sharply than in November (+1.8% after +0.5%). The price of oil seeds and vegetable oils remained dynamic (+4.0% after +3.3%). The price of beef meat jumped (+14.2% after +2.1%). Cereal prices strenghtened (+4.0% after +0.5%). However, the prices of tropical foodstuffs kept declining (−6.0% after −2.0%): the price of cacao dropped again (−6.6% after −7.3%) and the price of Arabica slipped back (−11.6% after +5.4%) due to large crop expectations. The price of sugar fell sharply again (−7.7% after −6.9%).
tableauTable2 – Imported raw materials (excluding energy) in euros
| Index | Changes (%) | |||
|---|---|---|---|---|
| of last month | over the last month | over the last 3 months | over the last 12 months | |
| Food total | 214.9 | 1.8 | 2.2 | 2.7 |
| Tropical foodstuffs | 195.1 | –6.0 | –7.2 | –13.4 |
| Oil seeds, vegetable oils | 245.7 | 4.0 | 4.6 | 15.2 |
| Cereals | 152.6 | 4.0 | 6.4 | 2.5 |
| Sugar | 200.1 | –7.7 | –6.2 | 29.7 |
| Beef meat | 154.9 | 14.2 | 15.4 | –2.9 |
| Industrial raw materials | 180.0 | 3.5 | 17.3 | 27.8 |
| Agricultural raw materials | 126.0 | 5.2 | 10.4 | 15.4 |
| Natural Fibres | 144.2 | 3.1 | 8.5 | 16.7 |
| Natural rubber | 190.5 | 13.6 | 36.8 | 60.8 |
| Hides | 82.1 | –0.2 | 8.8 | 8.8 |
| Wood pulp | 104.1 | 2.3 | 6.2 | 3.4 |
| Tropical wood | 98.8 | 2.7 | 1.0 | –13.9 |
| Sawn softwood | 109.3 | 6.7 | 8.4 | 23.5 |
| Minerals | 208.6 | 3.1 | 19.2 | 32.0 |
| Iron ore | 560.3 | 12.9 | 49.7 | 108.1 |
| Non-ferrous metals | 164.2 | 1.0 | 14.6 | 20.3 |
| Precious metals | 239.0 | –4.0 | –7.4 | 13.3 |
| All commodities | 187.2 | 2.9 | 11.4 | 17.0 |
- Source : INSEE
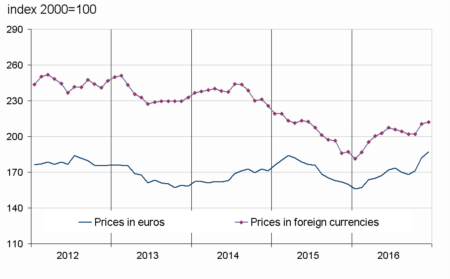
graphiqueGraph3 – Food
- Source: INSEE
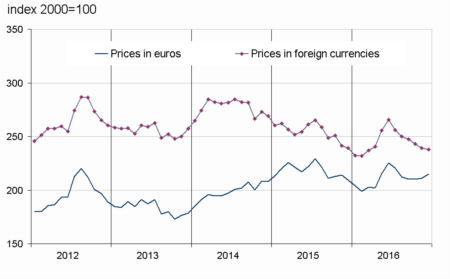
graphiqueGraph2 – Imported raw materials (excluding energy)
- Source: INSEE
graphiqueGraph4 – Industrial raw materials
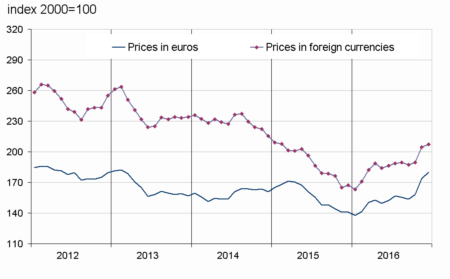
- Source: INSEE
Pour en savoir plus
Time series : Raw materials prices
