


 22 December 2016
2016- n° 341In October 2016, the sales volume accelerated in retail trade but declined in accommodation
and food services activities Sales volume in the retail trade and personal services - October 2016
22 December 2016
2016- n° 341In October 2016, the sales volume accelerated in retail trade but declined in accommodation
and food services activities Sales volume in the retail trade and personal services - October 2016
In October 2016, the sales volume accelerated in retail trade, except of motor vehicles and motorcycles (+1.4% after +0.3%). On the other hand, it shrank in accommodation and food service activities (−0.8% after +0.4% in September). It recovered in household services (+0.9% after −0.8%) and remained virtually stable in trade and repair of motor vehicles and motorcycles (+0.1%) .

Every index in this issue (except those on large scale food retailing survey) is in volume (tax excluded), seasonally and working day adjusted (SA-WDA). The commentary shows variations of subsections by decreasing contribution. The contribution of a subsection depends on the extent of the change and on its weight.
In October 2016, the sales volume accelerated in retail trade, except of motor vehicles and motorcycles (+1.4% after +0.3%). On the other hand, it shrank in accommodation and food service activities (−0.8% after +0.4% in September). It recovered in household services (+0.9% after −0.8%) and remained virtually stable in trade and repair of motor vehicles and motorcycles (+0.1%).
graphiqueGraph1 – Sales volume in the retail trade and personal services
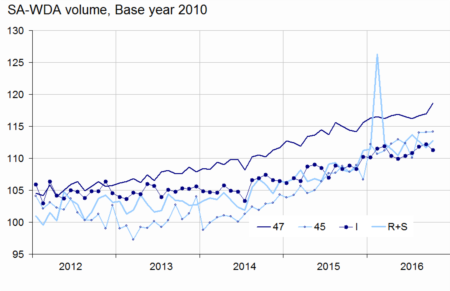
- Source: INSEE
Acceleration in retail trade
In October 2016, the sales volume in retail trade, except of motor vehicles and motorcycles accelerated after a slight increase in September (+1.4% after +0.3%). According to early estimates, it should be virtually stable in November (−0.1%).
The rise in October was due to specialised stores (+2.4%): the retail sale of other goods in specialised stores (clothes, fuels, etc..) accelerated considerably (+3.2% after +0.2%) while the retail sale of other household equipment recovered significantly (+1.9%
after −0.5%) and the retail sale of information and communication equipment went on increasing strongly (+3.7% after +3.3%). In non-specialised stores, the sales volume was virtually stable.
The sales volume in retail trade, except of motor vehicles and motorcycles increased over the last three months (+0.7%, q-o-q) and year on year (+2.1% y-o-y).
tableauTable1 – Variation of sales volume in the retail trade and personal services
| Change in % | |||||
|---|---|---|---|---|---|
| NACE rev.2 Classification | Weight | Oct./ Sept. | Sept./Aug. | q-o-q (1) | y-o-y (2) |
| 47 Retail trade, except of motor vehicles and motorcycles | 1000 | 1.4 | 0.3 | 0.7 | 2.1 |
| 471 Retail sale in non-specialized stores | 370 | 0.1 | 0.5 | 1.1 | 1.9 |
| 472 to 477 Retail sale in specialized stores | 572 | 2.4 | 0.3 | 0.4 | 2.1 |
| 478 and 479 Retail trade not in stores | 58 | 0.4 | –1.4 | 2.2 | 4.3 |
| 45 Trade and repair of motor vehicles and motorcycles | 1000 | 0.1 | 0.1 | 2.0 | 5.5 |
| I Accommodation and food service activities | 1000 | –0.8 | 0.4 | 1.3 | 2.8 |
| R+S Household services | 1000 | 0.9 | –0.8 | 0.1 | 3.6 |
| R Arts, entertainment and recreation | 422 | 0.2 | 0.0 | –2.2 | 8.3 |
| S Other service activities | 578 | 1.5 | –1.5 | 2.0 | 0.0 |
- (1) Quarter-on-quarter: last three months /previous three months.
- (2) Year-on-year: last three months / same three months of the previous year.
- The codes correspond to different levels of aggregation of the classification NAF rev.2
- Source: INSEE
tableauTable2 – Sales volume in the retail trade: early estimate*
| Change in % | ||
|---|---|---|
| Nov. 2016/ Oct. 2016 | Nov. 2016/ Nov. 2015 | |
| 47 Retail trade, except of motor vehicles and motorcycles | –0.1 | 3.9 |
- * Econometric estimate from a set of sources available within 30 days after the end of the reference month
- Source: INSEE
Near stabiliy in trade and repair of motor vehicles and motorcycles
The sales volume in trade and repair of motor vehicles and motorcycles was almost stable again in October (+0.1% as in September). In particular, it remained sluggish in sale of motor vehicles (+0.1% after +0.2%) but it recovered slightly in sale of motor vehicle parts and accessories (+0.3% after −0.5%).
The sales volume of the whole sector grew substantially over the last three months (+2.0%, q-o-q) and year-on-year (+5.5% y-o-y).
tableauTable3 – Sales volume in the retail trade and personal services
| Change in % | |||||
|---|---|---|---|---|---|
| NACE rev.2 Classification | Weight | Oct. 2016 | Oct./ Sept. | Sept./Aug. | q-o-q (1) |
| 47 Retail trade, except of motor vehicles and motorcycles | 1000 | 118.6 | 1.4 | 0.3 | 0.7 |
| 471 Non-specialised stores | 370 | 111.6 | 0.1 | 0.5 | 1.1 |
| 472 to 477 Specialised stores | 572 | 123.0 | 2.4 | 0.3 | 0.4 |
| 472 Retail sale of food, beverages and tobacco in specialised stores | 48 | 136.0 | 1.7 | 1.8 | 2.7 |
| 473 Retail sale of automotive fuel | 77 | 93.9 | –0.7 | –1.6 | –0.8 |
| 474 Retail sale of information and communication equipment | 28 | 187.2 | 3.7 | 3.3 | 0.6 |
| 475 Retail sale of other household equipment | 113 | 104.8 | 1.9 | –0.5 | –0.9 |
| 476 Retail sale of cultural and recreation goods | 48 | 109.5 | 1.8 | 0.7 | 1.7 |
| 477 Retail sale of other goods in specialised stores | 259 | 132.6 | 3.2 | 0.2 | 0.4 |
| 478 et 479 Retail trade not in stores | 58 | 120.9 | 0.4 | –1.4 | 2.2 |
| 45 Wholesale and retail trade and repair of motor vehicles and motorcycles | 1000 | 114.2 | 0.1 | 0.1 | 2.0 |
| 451 Sale of motor vehicles | 671 | 111.0 | 0.1 | 0.2 | 2.6 |
| 452 Maintenance and repair of motor vehicles | 78 | 104.7 | –0.6 | 0.6 | 1.3 |
| 453 Sale of motor vehicle parts and accessories | 227 | 129.4 | 0.3 | –0.5 | 0.8 |
| 454 Sale, maintenance and repair of motorcycles and related parts and accessories | 24 | 92.7 | –1.2 | 3.3 | 3.8 |
| I Accommodation and food service activities | 1000 | 111.3 | –0.8 | 0.4 | 1.3 |
| 55 Accommodation | 239 | 101.1 | –3.3 | 1.4 | –1.3 |
| 56 Food and beverage service activities | 761 | 114.4 | –0.1 | 0.1 | 2.0 |
| 561 Restaurants… | 560 | 114.8 | –0.5 | 0.6 | 2.5 |
| 562 Event catering… | 119 | 106.2 | 2.0 | –1.3 | –1.3 |
| 563 Beverage serving activities | 82 | 123.7 | –0.2 | –1.4 | 2.7 |
| R+S Household services | 1000 | 112.7 | 0.9 | –0.8 | 0.1 |
| R Arts, entertainment and recreation | 422 | 119.9 | 0.2 | 0.0 | –2.2 |
| 90 Creative, arts and entertainment activities | 116 | 100.4 | –8.1 | –2.2 | –1.4 |
| 91 Libraries, archives, museums… | 10 | 133.3 | 3.0 | 2.3 | 2.1 |
| 92 Gambling and betting activities | 106 | 115.2 | –1.3 | 3.2 | –2.7 |
| 93 Sports activities and amusement... | 190 | 133.9 | 5.2 | –0.5 | –2.5 |
| S Other service activities | 578 | 107.4 | 1.5 | –1.5 | 2.0 |
| 95 Repair of computers… | 206 | 92.3 | 5.1 | –2.9 | 0.4 |
| 96 Other personal service activities | 372 | 115.7 | 0.0 | –0.9 | 2.8 |
- (1) Quarter-on-quarter: last three months /previous three months.
- Source: INSEE
Downturn in accommodation and food services
In October, the sales volume fell back in accommodation and food service activities (−0.8% after +0.4% in September). This decrease came from the sharp decline in accommodation (−3.3% after +1.4% in September) whereas the sale volume remained virtually stable in food and beverage service activities (−0.1% after +0.1%). Within food and beverage service activities, the decline in restaurants and fast food activities (−0.5% after +0.6%) was practically offset by the rebound in event catering and other food services (+2.0% after −1.3%).
The sales volume of the whole sector improved over the last three months (+1.3% q-o-q) and year on year (+2.8% y-o-y).
Upturn in household services
In October, the sales volume in household services recovered (+0.9% after −0.8% in September). This increase was mainly owed to the strong bounce-back in repair of computers (+5.1% after −2.9%) and in sports activities and amusement. (+5.2% after −0.5%). However, the sales volume fell in creative, arts and entertainment activities (−8.1% after −2.2%) and in gambling and betting activities (−1.3% after +3.2%).
The sales volume in household services was virtually stable over the last three months (+0.1% q-o-q) and increased year on year (+3.6% y-o-y).
Revisions
The variation in the sales volume for September 2016 has been raised by 0.1 points in retail trade, except of motor vehicles and lowered by 0.3 points in household services. It is unchanged in the other sectors.
In November 2016, the turnover was almost unchanged in large-scale food retailing
In November 2016, the turnover in large-scale food retailing was practically stable (−0.1% after −0.5% in October). Sales of food products levelled off after a 2.3 percent decline in October while those of non food-products fell back (−1.5% after +0.5%). The sales of automotive fuel went on increasing (+1.5% after +3.1% in October).
tableauTable4 – Monthly turnover indices in large-scale food retailing
| Change in % | ||||
|---|---|---|---|---|
| Nov. 16/ Oct. 16 | Oct. 16/ Sept. 16 | q-o-q (1) | y-o-y (1) | |
| Turnover | –0.1 | –0.5 | 0.7 | 0.7 |
| Including | ||||
| Sales of food products | 0.0 | –2.3 | 0.9 | 0.7 |
| Sales of non-food products | –1.5 | 0.5 | –0.8 | –1.7 |
| Sales of automotive fuel | 1.5 | 3.1 | 4.6 | 2.7 |
- (1) Quarter-on-quarter: last three months / previous three months.
- Source: INSEE - Monthly survey on large scale food retailing (Emagsa)
Documentation
Methodology (pdf,121 Ko)
Pour en savoir plus
