


 20 December 2016
2016- n° 332In November 2016, overall agricultural producer prices increased by 2.7% over one
year Indices of agricultural prices - November 2016
20 December 2016
2016- n° 332In November 2016, overall agricultural producer prices increased by 2.7% over one
year Indices of agricultural prices - November 2016
In November 2016, overall agricultural prices continued to increase compared to last year : +2.7%, after +1.0% in October. Excluding fruits and vegetables, they went up by 0.9% over the month and by 1.3% over one year.
In November 2016, overall agricultural prices continued to increase compared to last year : +2.7%, after +1.0% in October. Excluding fruits and vegetables, they went up by 0.9% over the month and by 1.3% over one year.
The increases in the prices of cereals and oleaginous prices continued in November
In November, cereal prices rose again (+2.2 % after +2.6 % in October), owing to strong international demand and a slight appreciation of the dollar. They nevertheless remained lower than last year (−3.2% yoy), as the global supply was ample. Oleaginous prices kept on rising (+7.0% over three months) due to a retreating global production and a decision from the United States to increase the amount of vegetal oil in fuel.
graphiqueGraph1 – Producer prices of cereals
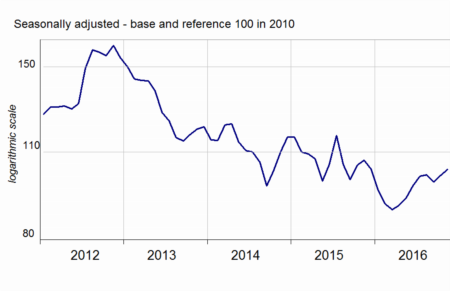
- Source: INSEE
Adverse weather conditions during the spring and the summer lessened the yields and the crops for many agricultural products. Hence potato prices surged compared to November 2015 (+38.9%). Similarly, fresh vegetables prices soared over one year (+28.0%) due to limited supply for the main traded vegetables in autumn (cauliflower, chicory, lettuce grown in winter). The prices of pears and apples prices significantly went up over one year reflecting a declining production. Wine prices became higher as well (+3.4% over one year), in particular those for protected designation of origin wines (+7.3%) whose crops were more affected by climatic hazards than the other wines.
graphiqueGraph2 – Producer prices of fresh vegetables
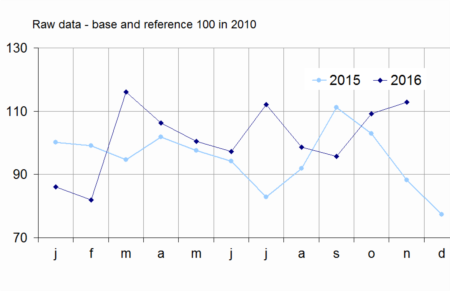
- Source: SSP (ministry in charge of agriculture)
Animal and milk prices picked up for three months
Animal prices rebounded for one quarter (+2.2% compared to August). Pig price (+3.1% since three months) was sustained by dynamic Asian demand. Big cattle one increased as well (+4.3% over three months). Conversely, calve prices dropped (−1.7% over three months and −8,1% over one year) reflecting the drop in consumption.
graphiqueGraph3 – Producer prices of pigs and large cattle
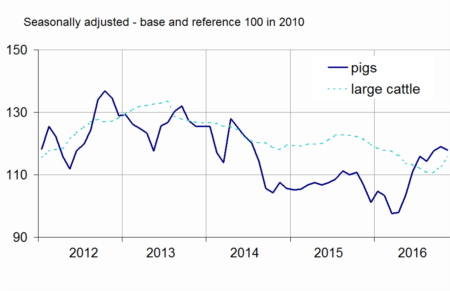
- Source: INSEE
Cow milk prices kept on picking up (+9.4% between August and October) but still decreased over one year. The production of the main export countries declined, while China drove the global demand up. The increase in eggs prices was sharper in November, as the production capacities have been diminishing since last spring.
tableauTable1 – Indices of producer prices of agricultural products (IPPAP)
| Variation as % over | |||||
|---|---|---|---|---|---|
| Weights | Nov. 2016 | a month | 3 months | a year | |
| Agricultural goods output | 1000 | 116.8 | /// | /// | +2.7 |
| excluding fruits and vegetables | 900 | 116.9 | +0.9 | +3.5 | +1.3 |
| Crop output (excluding fruits and vegetables) | 505 | 122.8 | +0.8 | +1.7 | +3.4 |
| Cereals | 188 | 103.4 | +2.2 | +2.2 | –3.2 |
| of which soft wheat | 112 | 100.6 | +2.2 | +0.4 | –3.6 |
| grain maize | 41 | 100.4 | +2.1 | +4.7 | +1.5 |
| Potatoes | 26 | 243.2 | /// | /// | +38.9 |
| Wines | 177 | 135.4 | –0.1 | +1.3 | +3.4 |
| protected designation of origin | 84 | 147.1 | –0.1 | +1.1 | +7.3 |
| other wines | 23 | 140.6 | –0.2 | +4.5 | –4.7 |
| Oleaginous | 49 | 105.1 | +1.5 | +7.0 | +0.5 |
| Horticultural products | 30 | 110.6 | –0.3 | +0.5 | +1.0 |
| Other crop products | 36 | 109.4 | +0.2 | +0.2 | +0.9 |
| Fruits and vegetables (1) | 100 | 115.7 | /// | /// | +15.7 |
| Fresh vegetables | 53 | 112.9 | /// | /// | +28.0 |
| Fresh fruits | 35 | 122.6 | /// | /// | +6.9 |
| Animal output | 395 | 109.5 | +1.0 | +6.3 | –1.4 |
| Animals | 234 | 113.0 | +0.4 | +2.2 | –1.1 |
| of which large cattle | 96 | 115.6 | +2.5 | +4.3 | –5.0 |
| calves | 26 | 100.1 | –2.9 | –1.7 | –8.1 |
| pigs | 54 | 117.9 | –0.8 | +3.1 | +11.5 |
| sheep | 10 | 117.4 | –2.4 | –0.8 | +1.9 |
| poultry | 46 | 108.9 | –0.2 | –0.3 | –2.5 |
| of which chicken | 28 | 108.7 | 0.0 | –0.3 | –2.8 |
| Milk | 147 | 99.8 | /// | +8.6 | –4.5 |
| of which cow milk (2) | 137 | 98.9 | /// | +9.4 | –4.9 |
| Eggs | 15 | 150.4 | +16.5 | +59.0 | +19.8 |
- * Except for fresh fruits, fresh vegetables and potatoes
- /// Absence of result due to the nature of these series
- (1) Including vegetables for industry.
- (2)The October value of cow milk price indice is carried forward in November
- Sources: INSEE, SSP (ministry in charge of agriculture)
Purchase prices of means of production dipped over the month and decreased over one year
In November 2016, intermediate consumption prices slightly fell back (−0.2%) due to the drop in energy prices. Over one year, input prices decreased (−3.1%), due to the sharp decline in fertilisers prices (−15.8%) and the decrease both in feed prices (−3.5%) and seeds prices (−2.4%). Capital goods prices still slightly increased (+0.2% after +0.4% in October) and went up by 1.1% over one year.
Revisions
The IPPAP of October 2016 have been raised by +0.8 points owing to the integration of the cow milk price. For the same reference month, the IPAMPA have been lowered by 0.1 points, following raw data revisions.
graphiqueGraph4 – Purchase prices of the means of agricultural production
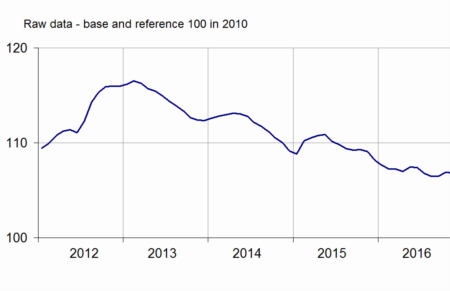
- Sources: INSEE, SSP (ministry in charge of agriculture)
tableauTable2 – Indices of purchase prices of the means of agricultural production (IPAMPA)
| Weights | Nov. 2016 | variation as % over | |||
|---|---|---|---|---|---|
| a month | 3 months | a year | |||
| Total input | 1000 | 106.8 | –0.1 | +0.3 | –2.1 |
| Intermediate consumptions | 764 | 106.5 | –0.2 | +0.2 | –3.1 |
| Energy | 100 | 95.2 | –1.8 | +4.3 | +1.1 |
| Seeds | 57 | 106.5 | +0.1 | –0.6 | –2.4 |
| Fertilisers and soil improvers | 92 | 97.8 | +0.8 | –0.2 | –15.8 |
| Plant protection products | 78 | 100.5 | –0.1 | –0.2 | –0.4 |
| Animal feed | 205 | 111.9 | 0.0 | –0.5 | –3.5 |
| Veterinary expenses | 43 | 118.2 | +0.1 | +0.3 | +3.1 |
| Small equipment and tools | 17 | 109.9 | 0.0 | +0.4 | +0.1 |
| Maintenance of materials | 67 | 113.7 | 0.0 | 0.0 | +0.3 |
| Maintenance of buildings | 9 | 107.8 | 0.0 | 0.0 | +1.2 |
| Other goods and services | 97 | 103.6 | 0.0 | –0.1 | –0.7 |
| Goods and services contributing to investment | 236 | 108.0 | +0.2 | +0.6 | +1.1 |
| Material | 186 | 109.0 | +0.2 | +0.7 | +1.1 |
| Tractors | 79 | 109.2 | +0.2 | +0.8 | +1.4 |
| Machinery and equipment for cultivation | 36 | 110.6 | +0.1 | –0.1 | +1.1 |
| Machinery and equipment for harvesting | 42 | 110.1 | +0.2 | +1.7 | +1.6 |
| Utility vehicles | 18 | 104.5 | +0.3 | +0.8 | –0.3 |
| Buildings | 50 | 104.2 | 0.0 | 0.0 | +1.0 |
- (1) The repayment of the domestic tax on energy product (TICPE) benefiting farmers has been applied in advance for the year 2016
- Sources: INSEE, SSP (ministry in charge of agriculture)
Documentation
Methodology (pdf,122 Ko)
Pour en savoir plus
Time series : Indices of agricultural prices
