


 8 December 2016
2016- n° 319The increase in employment continued in Q3 2016, buoyed by temporary work Payroll employment - third quarter 2016
8 December 2016
2016- n° 319The increase in employment continued in Q3 2016, buoyed by temporary work Payroll employment - third quarter 2016
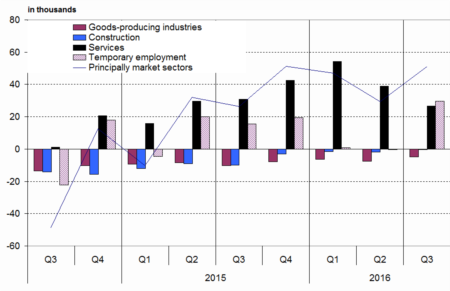
In Q3 2016, payroll employment in the non-farm market sectors continued to increase (+51,200 jobs, that is 0.3%, after +29,400 jobs in the previous quarter). This slight acceleration compared to the second quarter is due to temporary employment (+29,500 jobs, i.e. +5.0%, after −200 jobs in Q2 2016). Year-on-year, the principally market sectors created 178,700 net jobs (+1.1%).

Warning: The introduction of the “Déclaration Sociale Nominative” (DSN) to replace the “bordereau récapitulatif de cotisations” (BRC) may affect transitorily the declarative behavior of businesses. During the ramp-up phase of the DSN, adjustments are made in the statistical processing chain of employment estimates to reflect these changes. These changes are likely to generate more revisions than usual to data.
Payroll employment increased a little faster in the market sector
In Q3 2016, payroll employment in the non-farm market sectors continued to increase (+51,200 jobs, that is 0.3%, after +29,400 jobs in the previous quarter). This slight acceleration compared to the second quarter is due to temporary employment (+29,500 jobs, i.e. +5.0%, after −200 jobs in Q2 2016). Year-on-year, the principally market sectors created 178,700 net jobs (+1.1%).
Employment continued to decrease in industry but it stabilised in construction
In Q3 2016, industry continued to destroy more jobs than it created (−4,700 jobs, that is −0.2%, after –7,500 jobs, in Q2 2016). In construction, employment was virtually stable (−300, that is −0.0%, after –1,900 in the previous quarter). Year-on-year, industry lost 26,200 jobs (−0.8%) whereas construction shed 6,800 jobs (−0.5%).
Job creation accelerated in services, buoyed by temporary employment
After two quarters of stability, temporary work started to rise again in Q3 2016 (+29,500 jobs, i.e. +5.0 %). At the same time, employment in services excluding temporary work continued to increase (+26,600 jobs, i.e. 0.2 %, after +39,000 in Q2 2016). Overall, the pace of job creation in the market service sector was a little more dynamic than in the previous quarter (+56,200 jobs, that is +0.5%, after +38,800 in Q2 2016). Year-on-year, temporary employment increased sharply (+49,600 jobs, i.e. +8.8%) and the market service sector as a whole expanded by 211,700 jobs (+1.8%)
tableauTable1 – Payroll employment change in the competitive sector : thousands
| Change in 3 months | Change in 1 year | Level | ||
|---|---|---|---|---|
| 2016 | 2016 | 2016 | 2016 | |
| Q2 | Q3 | Q3 | Q3 | |
| Principally market sectors | 29.4 | 51.2 | 178.7 | 16, 095.4 |
| Goods-producing industries excl. Construction | –7.5 | –4.7 | –26.2 | 3, 103.6 |
| Manufacturing | –6.5 | –2.6 | –21.0 | 2, 739.2 |
| Construction | –1.9 | –0.3 | –6.8 | 1, 310.6 |
| Services | 38.8 | 56.2 | 211.7 | 11, 681.2 |
| of which : Temporary employment (**) | –0.2 | 29.5 | 49.6 | 615.6 |
| Principally non-market sectors (*) | 10.2 | 6.2 | 32.7 | 2, 040.1 |
| Total competitive sector (*) | 39.6 | 57.4 | 211.4 | 18, 135.5 |
- How to read it: In Q3 2016, net job creation in services amonted to 56,200 jobs from the previous quarter.
tableauTable2 – Payroll employment change in the competitive sector : percentage
| Change in 3 months | Change in 1 year | ||
|---|---|---|---|
| 2016 | 2016 | 2016 | |
| Q2 | Q3 | Q3 | |
| Principally market sectors | 0.2 | 0.3 | 1.1 |
| Goods-producing industries excl. Construction | –0.2 | –0.2 | –0.8 |
| Manufacturing | –0.2 | –0.1 | –0.8 |
| Construction | –0.1 | 0.0 | –0.5 |
| Services | 0.3 | 0.5 | 1.8 |
| of which : Temporary employment (**) | 0.0 | 5.0 | 8.8 |
| Principally non-market sectors (*) | 0.5 | 0.3 | 1.6 |
| Total competitive sector (*) | 0.2 | 0.3 | 1.2 |
- (*) Excl. Agriculture and public employees in non-markets sectors (administration, health, education and social activity) ; na : not available
- (**) Temporary workers are recorded in services, regardless of the sector in which they carry out their mission effectively.
- Source : INSEE
graphiqueGraph1 – Evolution of principally market sectors
Revisions
Compared with the flash estimate released on 10 November 2016, the estimated net job creation in principally market sectors in Q2 and Q3 2016 is virtually unchanged (−100 and −1,000 respectively).
tableauTable3 – Payroll employment change in the competitive sector (*)
| Code | Change in 3 months | Change in 1 year | Level | ||
|---|---|---|---|---|---|
| Naf | 2016 | 2016 | 2016 | 2016 | |
| rev.2 | Q2 | Q3 | Q3 | Q3 | |
| DE | Electricity, gas, steam, and air conditioning supply ; water supply, sewerage, waste management and remediation activities | –1.0 | –2.1 | –5.2 | 364.4 |
| C1 | Manufacture of food products beverage and tobacco products | 0.8 | 0.0 | 3.8 | 551.8 |
| C2 | Manufacture of coke, and refined petroleum products | 0.0 | –0.1 | –0.2 | 9.3 |
| C3 | Manufacture of computer, electronic and electrical products; manufacture of machinery and equipment | –3.0 | –1.2 | –10.2 | 416.5 |
| C4 | Manufacture of transport equipment | –1.4 | 0.9 | –1.7 | 345.8 |
| C5 | Other manufacturing | –2.9 | –2.2 | –12.7 | 1, 415.7 |
| FZ | Construction | –1.9 | –0.3 | –6.8 | 1, 310.6 |
| GZ | Wholesale and retail trade ; repair of motor vehicles and motorcycles | 4.4 | 6.0 | 25.8 | 3, 044.7 |
| HZ | Transportation and storage | 7.7 | 1.0 | 14.8 | 1, 355.1 |
| IZ | Accommodation and food service activities | 3.0 | 2.3 | 24.2 | 1, 027.1 |
| JZ | Information and communication | 5.2 | 5.4 | 19.8 | 729.8 |
| KZ | Financial and insurance activities | 0.1 | –1.2 | 0.9 | 854.7 |
| LZ | Real estate activities | 0.6 | –0.7 | 2.3 | 235.3 |
| MN | Professional, scientific and technical activities; administrative and support service activities | 16.9 | 43.2 | 116.5 | 3, 144.7 |
| of which : Temporary employment | –0.2 | 29.5 | 49.6 | 615.6 | |
| OQ | Public administration and defence ; compulsory social security; education; human health and social work activities | 10.2 | 6.2 | 32.7 | 2, 040.1 |
| RU | Other service activities | 0.9 | 0.1 | 7.5 | 1, 289.8 |
- (*) Excl. agriculture and public employees in non-markets sectors (administration, health, education and social activity)
- Source: INSEE
Documentation
Methodology (pdf,135 Ko)
Pour en savoir plus
