


 29 November 2016
2016- n° 310French GDP increased by 0.2% in Q3 2016 Quarterly national accounts - second estimate - third quarter 2016
29 November 2016
2016- n° 310French GDP increased by 0.2% in Q3 2016 Quarterly national accounts - second estimate - third quarter 2016
In Q3 2016, gross domestic product (GDP) in volume terms* recovered moderately: +0.2%, after −0.1% in Q2.
Household consumption expenditure stagnated for the second quarter in a row, whereas gross fixed capital formation (GFCF) increased slightly (+0.2% after 0.0%). All in all, final domestic demand (excluding inventory changes) was virtually stable: it contributed to GDP growth for +0.1 points in Q3, as in the previous quarter.
Imports sharply bounced back (+2.5% after −1.7%). Exports recovered (+0.5% after −0.1%). All in all, foreign trade balance contributed negatively to GDP growth (−0.6 points after +0.5 points). Conversely, changes in inventories contributed positively (+0.7 points after −0.7 points).

* This growth rate is seasonally and working-day adjusted; volumes are chain-linked previous-year-prices volumes.
graphiqueGraph – GDP and its main components
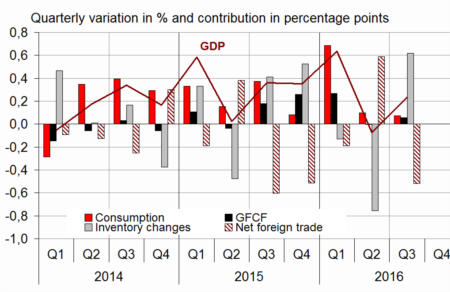
- Source: INSEE
tableauTable1 – Goods and services: supply and uses chain-linked volumes
| 2015 Q4 | 2016 Q1 | 2016 Q2 | 2016 Q3 | 2015 | 2016 (ovhg) | |
|---|---|---|---|---|---|---|
| GDP | 0.4 | 0.6 | -0.1 | 0.2 | 1.2 | 1.1 |
| Imports | 2.3 | 0.3 | -1.7 | 2.5 | 6.4 | 2.7 |
| Household consumption *expenditure | -0.1 | 1.1 | 0.0 | 0.0 | 1.5 | 1.4 |
| General government's *consumption expenditure | 0.4 | 0.4 | 0.4 | 0.3 | 1.4 | 1.4 |
| GFCF | 1.2 | 1.2 | 0.0 | 0.2 | 0.9 | 2.6 |
| *of which Non-financial corporated and unincorporated enterprises | 1.5 | 1.9 | -0.2 | -0.4 | 2.7 | 3.2 |
| Households | 0.4 | 0.3 | 0.4 | 0.6 | -0.8 | 1.3 |
| General government | 1.5 | -0.1 | 0.4 | 1.1 | -3.9 | 2.2 |
| Exports | 0.7 | -0.5 | -0.1 | 0.5 | 6.0 | 0.5 |
| Contributions : | ||||||
| Internal demand excluding inventory changes | 0.3 | 0.9 | 0.1 | 0.1 | 1.3 | 1.6 |
| Inventory changes | 0.5 | -0.1 | -0.7 | 0.7 | 0.2 | 0.2 |
| Net foreign trade | -0.5 | -0.2 | 0.5 | -0.6 | -0.3 | -0.7 |
- Source: INSEE
Total production recovered
In Q3 2016, production in goods and services bounced back (+0.5% after −0.2%). It recovered in services (+0.7% after −0.1%) and it levelled off in goods (0.0% after −0.7%). Production began to increase again in construction (+1.0% after −0.3%). Output in manufactured goods recovered (+0.6% after −1.0%). In particular, it bounced back in coke and refined petroleum industry (+13.6% after −12.8%) after industrial action in May and June. However, output in transport equipment significantly fell back (−3.2% after +1.4%). Energy production shrank (−2.5% after +0.8%).
tableauTable2 – Production, consumption and GFCF: main components
| 2015 Q4 | 2016 Q1 | 2016 Q2 | 2016 Q3 | 2015 | 2016 (ovhg) | |
|---|---|---|---|---|---|---|
| Production of branches | 0.5 | 0.6 | -0.2 | 0.5 | 1.3 | 1.3 |
| Goods | 0.4 | 0.1 | -0.7 | 0.0 | 1.2 | -0.1 |
| Manufactured Industry | 0.7 | 0.1 | -1.0 | 0.6 | 1.5 | 0.2 |
| Construction | 0.6 | 0.4 | -0.3 | 1.0 | -2.2 | 0.7 |
| Market services | 0.6 | 0.9 | -0.1 | 0.7 | 1.8 | 2.0 |
| Non-market services | 0.3 | 0.4 | 0.3 | 0.3 | 1.0 | 1.2 |
| Household consumption | -0.1 | 1.1 | 0.0 | 0.0 | 1.5 | 1.4 |
| Food products | 0.3 | 0.4 | -0.6 | 0.9 | 1.2 | 0.9 |
| Energy | -2.7 | 1.9 | 1.5 | -1.7 | 1.4 | 0.7 |
| Engineered goods | -0.2 | 2.2 | 0.2 | -1.2 | 2.6 | 2.2 |
| Services | 0.3 | 0.7 | -0.2 | 0.4 | 1.0 | 1.3 |
| GFCF | 1.2 | 1.2 | 0.0 | 0.2 | 0.9 | 2.6 |
| Manufactured goods | 3.3 | 2.7 | 0.2 | -2.6 | 2.1 | 5.5 |
| Construction | 0.6 | 0.5 | -0.1 | 0.8 | -2.2 | 1.0 |
| Market services | 0.6 | 1.1 | 0.1 | 1.2 | 4.4 | 2.9 |
- Source: INSEE
Household consumption remained stable
In Q3 2016, household consumption expenditure stagnated again. Expenditures moderately bounced back in services (+0.4% after −0.2%) whereas they declined in goods (−0.5% after +0.1%).
In detail, expenditure on energy fell back in summer after being dynamic in the first half of the year due to temperatures below seasonal norms (−1.7% after +1.5%). Consumption of engineered goods declined (−1.2% after +0.2%), especially household equipment (−6.1%) after two quarters of very brisk growth (+7.3% in Q1 and +3.4% in Q2). By constrast, consumption of food products bounced back (+0.9% after −0.6%).
Household investment accelerated, corporate investment fell again
Global GFCF rose slightly in Q3 (+0.2% after 0.0%). Investment in construction increased by 0.8% (after −0.1%), especially in civil engineering. Investment in market services also recovered (+1.2% after +0.1%), particularly in software. Conversely, GFCF in manufactured goods fell back sharply (−2.6% after +0.2%), especially in transport equipment and capital goods.
Foreign trade balance weighed down on GDP growth
In Q3 2016, imports recovered sharply (+2.5% after −1.7%), particularly due to purchases of raw hydrocarbons and transport equipment. At the same time, exports accelerated moderately (+0.5% after −0.1%). Sales in food products, refined petroleum products, capital goods and other industrial goods increased but those in agricultural products tumbled. All in all, foreign trade balance weighed down on GDP growth in Q3: −0.6 points after +0.5 points in the previous quarter.
The contribution of changes in inventories to GDP growth was positive
In Q3, changes in inventories contributed to GDP growth by +0.7 points, after −0.7 points in Q2. In particular, they increased in transport equipment, raw hydrocarbons and equipment goods.
Revisions
GDP growth estimate for Q3 2016 is confirmed, at +0.2%. The contributions of foreign trade balance and changes in inventories are slightly accentuated.
tableauTable3 – Sectoral accounts
| 2015 Q4 | 2016 Q1 | 2016 Q2 | 2016 Q3 | 2015 | 2016 (ovhg) | |
|---|---|---|---|---|---|---|
| Profit ratio of NFC* (level) | 31.6 | 32.0 | 31.7 | 31.4 | ||
| Household purchasing power | 0.5 | 0.6 | 0.2 | 1.6 | 1.5 |
- *NFC: non-financial corporations
- Source: INSEE
tableauTable4 – Households' disposable income and ratios of households' account
| 2015 Q4 | 2016 Q1 | 2016 Q2 | 2016 Q3 | 2015 | 2016 (ovhg) | |
|---|---|---|---|---|---|---|
| HDI | 0.5 | 0.5 | 0.3 | 1.4 | 1.4 | |
| Household purchasing power | 0.5 | 0.6 | 0.2 | 1.6 | 1.5 | |
| HDI by cu* (purchasing power) | 0.4 | 0.5 | 0.1 | 1.2 | 1.1 | |
| Adjusted HDI (purchasing power) | 0.5 | 0.6 | 0.2 | 1.6 | 1.5 | |
| Saving rate (level) | 14.9 | 14.5 | 14.6 | 14.5 | ||
| Financial saving rate (level) | 5.9 | 5.7 | 5.6 | 5.5 |
- *cu: consumption unit
- Source: INSEE
tableauTable5 – Ratios of non-financial corporations' account
| 2015 Q4 | 2016 Q1 | 2016 Q2 | 2016 Q3 | 2015 | |
|---|---|---|---|---|---|
| Profit share | 31.6 | 32.0 | 31.7 | 31.4 | |
| Investment ratio | 23.0 | 23.2 | 23.3 | 22.9 | |
| Savings ratio | 20.0 | 21.2 | 20.5 | 19.7 | |
| Self-financing ratio | 86.9 | 91.4 | 88.1 | 86.3 |
- Source: INSEE
tableauTable6 – Expenditure, receipts and net borrowing of public administrations
| 2015 Q4 | 2016 Q1 | 2016 Q2 | 2016 Q3 | 2015 | |
|---|---|---|---|---|---|
| In billions of euros | |||||
| Total expenditure | 310.8 | 313.9 | 314.9 | 1242.8 | |
| Total receipts | 295.5 | 295.4 | 297.2 | 1166.3 | |
| Net lending (+) or borrowing (-) | -15.3 | -18.4 | -17.7 | -76.5 | |
| In % of GDP | |||||
| Net lending (+) or borrowing (-) | -2.8 | -3.3 | -3.2 | -3.5 |
- Source: INSEE
Pour en savoir plus
Time series : Operations on goods and services
Time series : Gross domestic product balance
Time series : Institutional sector accounts
Time series : Branch accounts
