


 24 November 2016
2016- n° 301In November 2016, the business climate in manufacturing holds steady above its long-term
average Monthly business survey (goods-producing industries) - November 2016
24 November 2016
2016- n° 301In November 2016, the business climate in manufacturing holds steady above its long-term
average Monthly business survey (goods-producing industries) - November 2016
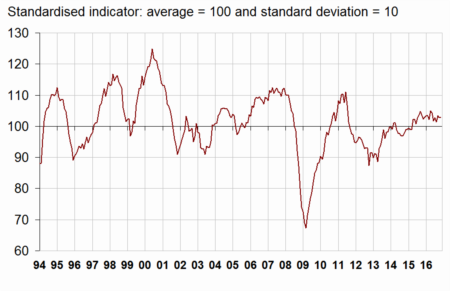
According to the business managers surveyed in November 2016, the business climate in industry has held steady at 103 since September, above its long-term average (100).
- Personal production expectations weakened a little
- Revisions
- In the manufacture of food products and beverages, the business climate is significantly above normal
- In the manufacture of machinery and equipment goods, the business climate has returned to its mean level
- The business climate has faltered in the manufacture of transport equipment
- The business climate remains just above normal in “other manufacturing”
According to the business managers surveyed in November 2016, the business climate in industry has held steady at 103 since September, above its long-term average (100).
graphiqueGraph 1 – Business climate in industry - Composite indicator
The turning-point indicator is now in the zone indicating further favourable economic outlook.
graphiqueGraph 2 – Turning-point indicator
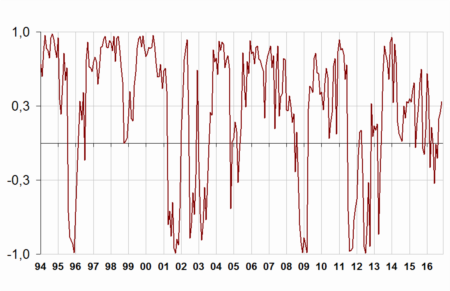
- How to read it: close to 1 (respectively −1), the indicator points to a favourable short-term economic situation (respectively unfavourable). Between −0.3 and +0.3: uncertainty area.
Personal production expectations weakened a little
In November 2016, the balance of opinion on past activity, already above normal, has slightly increased and has returned to its September's level. That on personal production expectations has decreased a little albeit remaining slightly above its long-term average.
Business managers in manufacturing are a little more upbeat than in October on general production prospects in the sector (+2 points). The corresponding balance has been above its long-term average since February 2015.
In November, the balances on global and export order books are virtually stable and above their mean.
Finally, a few less industrialists than in October consider that finished-goods inventories are above normal: the corresponding balance has lost 2 points, and has moved from its long-term average.
tableauTable 1 – Industrialists' opinion on manufacturing activity
| Manufacturing industry | Ave.* | Aug. 16 | Sept. 16 | Oct. 16 | Nov. 16 |
|---|---|---|---|---|---|
| Composite indicator | 100 | 101 | 103 | 103 | 103 |
| Past activity | 4 | 6 | 9 | 7 | 9 |
| Finished-goods inventory | 13 | 9 | 11 | 10 | 8 |
| Global order books | –18 | –16 | –14 | –15 | –16 |
| Export order books | –14 | –9 | –11 | –11 | –10 |
| Personal production expectations | 5 | 2 | 9 | 9 | 7 |
| General production expectations | –9 | 1 | 6 | 1 | 3 |
- * Long-term average since 1976.
- Source: INSEE - Monthly business tendency survey in industry
Revisions
The business climate in manufacturing in October 2016 has been raised by one point. This slight revision results from late answers from businesses that have been taken into account.
The stability in the business climate in industry stems from a slight improvement in the manufacture of food products and beverages and in that of machinery and equipment goods, offset by a slight deterioration in the manufacture of transport equipment and in “other manufacturing”.
In the manufacture of food products and beverages, the business climate is significantly above normal
In the manufacture of food products and beverages, the business climate has increased by one point in October. It has reached its highest level since August 2015, significantly above its long-term average. This slight increase mainly comes from a rise in the balances of opinion on personal production expectations and on global order books. It is partly offset by the decrease in the balance on past activity.
In the manufacture of machinery and equipment goods, the business climate has returned to its mean level
In the manufacture of machinery and equipment goods, the business climate has recovered by two points. Returning to its mean, it has reached its highest level since seven months. This improvement is mainly due to a rebound in the balance on past activity and an increase of that on export order books.
On a sub-sector level, the composite indicator, already significantly above its mean level, has slightly climbed again in computer, electronic and optical product industry. In electrical equipment and in machinery and equipment, the business climates have improved but are still below normal.
The business climate has faltered in the manufacture of transport equipment
In the manufacture of transport equipment, the business climate has lost two points albeit remaining above normal. Specifically, the balance on export order books has declined.
The business climate has lost two points in the manufacture of motor vehicles, trailers and semi-trailers. It is stable in that of other transport equipment. Both climates are above their long-term average.
The business climate remains just above normal in “other manufacturing”
In overall “other manufacturing”, the business climate has lost one point but remains just above normal. The balance of opinion on past activity has diminished but that on personal production expectations has risen again.
In clothing-textiles and in “other manufacturing industries”, the business climates have improved and are above normal. However, the climate has slightly decreased in rubber and plastic products albeit remaining above its mean. In wood-paper, basic metals and in chemicals, the business climates, virtually stable, remain close to their mean.
graphiqueGraph 3 – Business climates in a sector-based approach
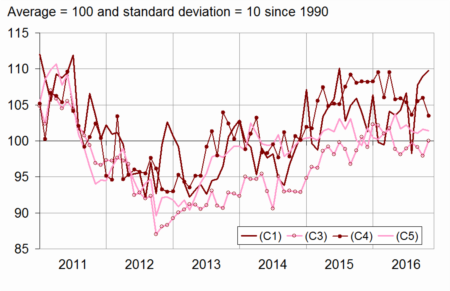
- Legend: (C1): Manufacture of food products and beverages - (C3): Machinery and equipment goods - (C4): Manufacture of transport equipment - (C5): Other manufacturing
tableauTable 2 – Business climates in a sector-based approach
| NA* : (A17) et [A38 et A64] | Weights** (%) | Sept. 16 | Oct. 16 | Nov. 16 |
|---|---|---|---|---|
| (C1) Man. of food products and beverages | 21 | 108 | 109 | 110 |
| (C3) Machinery and equipment goods | 11 | 99 | 98 | 100 |
| [CI] Computer, electronic and optical products | 3 | 104 | 106 | 107 |
| [CJ] Electrical equipment | 3 | 93 | 97 | 98 |
| [CK] Machinery and equipment | 5 | 100 | 96 | 98 |
| (C4) Man. of transport equipment | 15 | 106 | 106 | 104 |
| [CL1] Motor vehicles, trailers and semi-trailers | 7 | 105 | 104 | 102 |
| [CL2] Other transport equipment | 8 | 104 | 105 | 105 |
| (C5) Other manufacturing | 46 | 101 | 102 | 101 |
| [CB] Textiles, clothing industries, leather and footwear industry | 2 | 111 | 106 | 108 |
| [CC] Wood, paper, printing | 5 | 98 | 100 | 99 |
| [CE] Chemicals and chemical products | 9 | 97 | 101 | 100 |
| [CG] Rubber and plastic products | 7 | 100 | 104 | 102 |
| [CH] Basic metals and fabricated metal products | 11 | 100 | 101 | 100 |
| [CM] Other manufacturing industries | 9 | 103 | 97 | 101 |
- * NA: aggregated classification, based on the French classification of activities NAF rév.2.
- ** Weights used to aggregate sub-sector's balances of opinion.
- Source: INSEE - Monthly business tendency survey in industry
Documentation
Methodology (pdf,133 Ko)
Pour en savoir plus
Time series : Industry - Activity and demand
