


 27 October 2016
2016- n° 282In September 2016, overall agricultural producer prices fell back by 0,9 % over one
year Indices of agricultural prices - September 2016
27 October 2016
2016- n° 282In September 2016, overall agricultural producer prices fell back by 0,9 % over one
year Indices of agricultural prices - September 2016
In September 2016, overall producer prices of agricultural products decreased compared to last year: −0.9% over one year, after +0.5% in August. Excluding fruits and vegetables, they went down by 0.4% yoy and increased by 0.5% over one month.
In September 2016, overall producer prices of agricultural products decreased compared to last year: −0.9% over one year, after +0.5% in August. Excluding fruits and vegetables, they went down by 0.4% yoy and increased by 0.5% over one month.
Over the month, cereal prices retreated, oleaginous ones kept up climbing
Cereal prices went down by 2.6% in September as a result of ample global supply, marked by good crops of wheat and maïze in the United-States and in Western Europe.
On the other hand, oleaginous prices continued to rise (+2,7% after +2.2% in August). They were sustained by a drop in rape production in Europe coupled with the upturn in oil prices that revived interest in hydrocarbon substitution by colza.
graphiquecereal – Producer prices of cereals
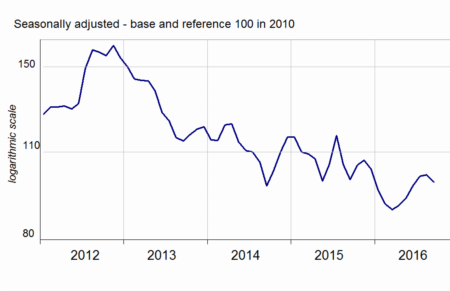
- Source: INSEE
Over one year, potatoes and fruits became more expensive but vegetables prices tumbled
Potato price was much higher (+26.4%) than in September 2015. The new crop in North-Western Europe was lower than the previous one: bad weather conditions lessened the yields.
Over one year, the prices of fruits and vegetables prices markedly fell back in September (−5.6% after +7.8%). Fresh fruits prices still increased (+5.8% in September after +10.1%): the consumers still favored summer fruits as summer weather persisted. In addition, weather conditions had hampered pear production.
Fresh vegetable prices plummeted in September (−13.9% over one year). Noticeably, melon price sharply dropped reflecting a surge of products in the end of the season, as the demand, however dynamic, was not sufficient to absorb this supply. Tomato price plunged too reflecting a marked increase in greenhouse production.
graphiquevegetable – Producer prices of fresh vegetables
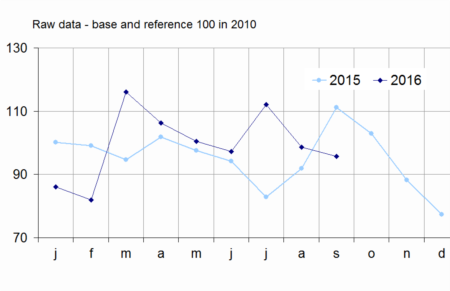
- Source: SSP (ministry in charge of agriculture)
Animal prices rebounded slightly
Animal prices picked up in September (+0.6 % over one month after −0.6%). Pig prices kept on growing (+5.9% over one month ; +7.7% yoy), buoyed by dynamic Chinese demand. On the other hand, large cattle prices have been dwindling for one year (−9.6 %) due to a larger amount of dairy cows slaughtering in Europe in relation with the milk crisis.
graphiquepig – Producer prices of pigs and large cattle
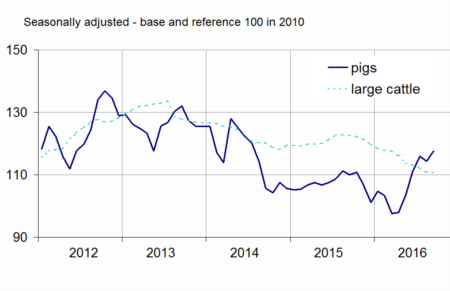
- Source: INSEE
Milk price kept on falling (−4.1 % from June to August 2016) due to a huge supply resulting from the end of quotas and the Russian embargo. Egg prices rebounded (+19.1% after −9.4%) following massive slaughtering of hens aimed at cutting the supply.
tableauTab1 – Indices of producer prices of agricultural products (IPPAP)
| Variation as % over | |||||
|---|---|---|---|---|---|
| Weights | Sept. 2016 | a month | 3 months | a year | |
| Agricultural goods output | 1000 | 112.4 | /// | /// | –0.9 |
| excluding fruits and vegetables | 900 | 113.3 | +0.5 | +0.4 | –0.4 |
| Crop output (excluding fruits and vegetables) | 505 | 120.6 | +0.1 | +1.2 | +4.0 |
| Cereals | 188 | 98.6 | –2.6 | +1.2 | –0.9 |
| of which soft wheat | 112 | 96.9 | –3.3 | +6.7 | +4.5 |
| grain maize | 41 | 94.7 | –1.3 | –8.3 | 0.0 |
| Potatoes | 26 | 250.2 | /// | /// | +26.4 |
| Wines | 177 | 134.8 | +1.0 | –0.4 | +4.5 |
| protected designation of origin | 84 | 147.6 | +1.4 | +1.6 | +10.8 |
| other wines | 23 | 136.6 | +1.6 | –8.4 | –7.6 |
| Oleaginous | 49 | 100.9 | +2.7 | +0.8 | +1.4 |
| Horticultural products | 30 | 109.4 | –0.5 | –1.3 | +1.1 |
| Other crop products | 36 | 108.6 | +0.1 | –0.1 | +0.8 |
| Fruits and vegetables (1) | 100 | 104.6 | /// | /// | –5.6 |
| Fresh vegetables | 53 | 95.7 | /// | /// | –13.9 |
| Fresh fruits | 35 | 116.8 | /// | /// | +5.8 |
| Animal output | 395 | 103.9 | +1.1 | –1.0 | –6.0 |
| Animals | 234 | 111.3 | +0.6 | +0.5 | –2.6 |
| of which large cattle | 96 | 110.6 | –0.2 | –2.4 | –9.6 |
| calves | 26 | 102.6 | +0.8 | –1.1 | +1.6 |
| pigs | 54 | 117.6 | +2.9 | +5.9 | +7.7 |
| sheep | 10 | 117.9 | –0.4 | +7.4 | +0.4 |
| poultry | 46 | 109.3 | +0.1 | –0.2 | –1.8 |
| of which chicken | 28 | 108.8 | –0.2 | –0.5 | –2.5 |
| Milk | 147 | 91.2 | /// | –4.1 | 11.0 |
| of which cow milk (2) | 137 | 89.7 | /// | –4.5 | –11.9 |
| Eggs | 15 | 112.7 | +19.1 | +2.3 | –15.2 |
- * Except for fresh fruits, fresh vegetables and potatoes
- /// Absence of result due to the nature of these series
- (1) Including vegetables for industry.
- (2)The August value of cow milk price indice is carried forward in September
- Sources: INSEE, SSP (ministry in charge of agriculture)
Purchase prices of means of production were stable m-o-m and decreased by 2.6% y-o-y
In September 2016, intermediate consumptions prices were stable over one month. The rise in energy prices, in particular oil products, was offset by the drop in fertilisers and feed prices. Over one year, input prices declined by 3.5%, mostly reflecting the significant fall in fertilisers prices (−16.9%) and the slide in feed prices (−4.5 %). Capital goods prices were stable over one month and increased over one year (+0.7%).
graphiquemeans – Purchase prices of the means of agricultural production
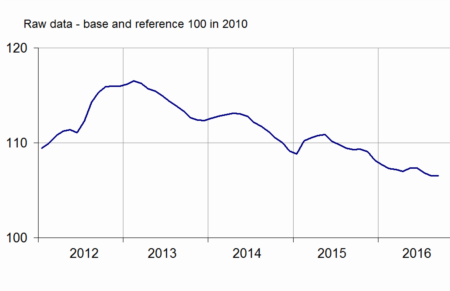
- Sources: INSEE, SSP (ministry in charge of agriculture)
tableauTab2 – Indices of purchase prices of the means of agricultural production (IPAMPA)
| Weights | Sept. 2016 | variation as % over | |||
|---|---|---|---|---|---|
| a month | 3 months | a year | |||
| Total input | 1000 | 106.5 | 0.0 | –0.7 | –2.6 |
| Intermediate consumptions | 764 | 106.3 | 0.0 | –1.1 | –3.5 |
| Energy | 100 | 92.5 | +1.3 | –3.0 | –2.8 |
| Seeds | 57 | 105.3 | –0.1 | –1.0 | –3.1 |
| Fertilisers and soil improvers | 92 | 97.3 | –0.8 | –6.4 | –16.9 |
| Plant protection products | 78 | 100.6 | +0.2 | +0.1 | –0.1 |
| Animal feed : cereals, meals, processed food,… | 205 | 112.3 | –0.4 | +0.1 | –4.5 |
| Veterinary expenses | 43 | 118.6 | 0.0 | +0.8 | +3.0 |
| Small equipment and tools | 17 | 108.2 | 0.0 | –0.3 | –1.4 |
| Maintenance of materials | 67 | 113.7 | 0.0 | +0.3 | +0.4 |
| Maintenance of buildings | 9 | 107.7 | 0.0 | +0.1 | +0.9 |
| Other goods and services | 97 | 104.9 | –0.1 | –0.1 | +3.1 |
| Goods and services contributing to investment | 236 | 107.5 | 0.0 | +0.3 | +0.7 |
| Material | 186 | 108.4 | +0.1 | +0.3 | +0.7 |
| Tractors | 79 | 108.4 | +0.1 | +0.1 | +0.6 |
| Machinery and equipment for cultivation | 36 | 111.1 | +0.4 | +0.8 | +1.5 |
| Machinery and equipment for harvesting | 42 | 108.4 | +0.1 | +0.3 | +0.7 |
| Utility vehicles | 18 | 104.3 | +0.2 | –0.1 | –0.2 |
| Buildings | 50 | 104.4 | 0.0 | +0.6 | +1.0 |
- (1) The repayment of the domestic tax on energy product (TICPE) benefiting farmers has been applied in advance for the year 2016
- Sources: INSEE, SSP (ministry in charge of agriculture)
Revisions
The variation in IPAMPA over one year in August 2016 is lowered by 1.0 point. It amounts to −2.7%, instead of −1.7% due to revisions in raw data (fertilisers, feed and seeds). The variation in the index of producer prices for agricultural products (IPPAP) has not been revised.
Documentation
Methodology (pdf,122 Ko)
Pour en savoir plus
Time series : Indices of agricultural prices
