


 18 October 2016
2016- n° 271In September 2016, oil price is almost unchanged Prices of oil and raw material imports - September 2016
18 October 2016
2016- n° 271In September 2016, oil price is almost unchanged Prices of oil and raw material imports - September 2016
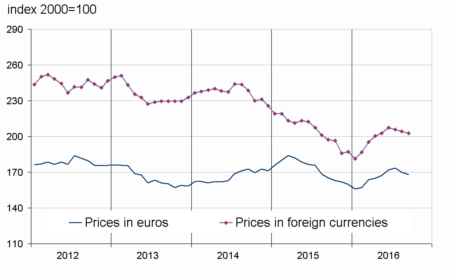
In September 2016, the crude oil price in euros was practically stable (+0.1% after +1.0%). At €41.2 on average per barrel, the Brent price approached its level of October 2015 (42.2€). Prices in euros of the other imported commodities went down for the second month in a row (−1,2% after −2.0%): raw food materials prices decreased again − less than in August, however (−1.0% after −3.7%) − and the prices of industrial raw materials slid further (−1.3% after −0.9%).

Erratum: this Informations Rapides replaces and supersedes the issue published on 18 October 2016 at 12 am, the month was wrong in the first sentence of the second paragraph.
In September 2016, the crude oil price in euros was practically stable (+0.1% after +1.0%). At €41.2 on average per barrel, the Brent price approached its level of October 2015 (42.2€). Prices in euros of the other imported commodities went down for the second month in a row (−1,2% after −2.0%): raw food materials prices decreased again − less than in August, however (−1.0% after −3.7%) − and the prices of industrial raw materials slid further (−1.3% after −0.9%).
Oil price was practically unchanged
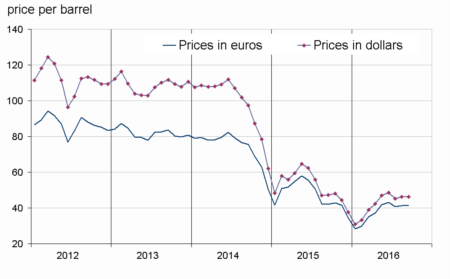
In September, the price in euros of crude oil from the North Sea (Brent) was virtually stable (+0.1% after +1.0%). Expressed in dollars, the price of a barrel was also almost unchanged (+2.4% after −7.0%) since the euro-dollar exchange rate remained stable over the month.
graphiqueG_petrole_ang – Oil (Brent)
- Source : INSEE
tableautabpetrole – Oil and petroleum products
| Prices | Change (%) | |||
|---|---|---|---|---|
| of last month | over the last month | over the last 3 months | over the last 12 months | |
| Brent in $ per barrel | 46.2 | 0.1 | –4.7 | –2.2 |
| Brent in € per barrel | 41.2 | 0.1 | –4.5 | –2.2 |
| Gasoline €/L | 0.339 | 4.2 | –4.4 | 6.8 |
| Gas Oil | 373.4 | 2.6 | –5.7 | –11.0 |
| Heavy fuel | 246.6 | 0.3 | 2.8 | 11.3 |
| Naphtha | 349.1 | 8.3 | –6.4 | –5.0 |
- Prices are in euros per tonne unless otherwise specified
- Source : INSEE
The decline in raw food material prices eased
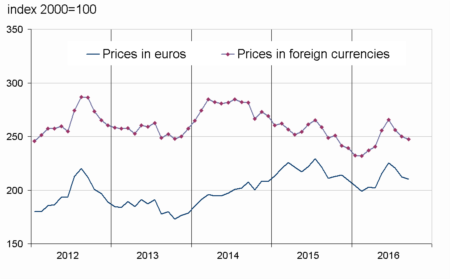
Expressed in euros, the prices of raw food materials fell for the third month in a row but this decline eased (−1.0% after −3,7% in August and −2.1% in July). Cereal prices fell less than in August (−3.8% after −9.2%), since the decline in rice price was less pronounced (−7.3% after −10.4%). Despite a decrease in the cacao price, tropical foodstuff prices went down at a slower pace (−0.3% after −2.3%) because of a rebound in arabica and robusta prices. The prices of oil seeds and vegetable oils were practically stable (−0.1%), after two month of significant decrease
(−4.7% on average). The price of sugar went on increasing (+6.6% after +0.3%), because of reduced crop forecasts in Bresil. However, the price of beef meat decreased more than in August (−6.3% after −1.3%), as the growing slaughters of dairy cows expanded an already high supply.
graphiqueG_alim_ang – Food
- Source : INSEE
Industrial commodity prices fell again
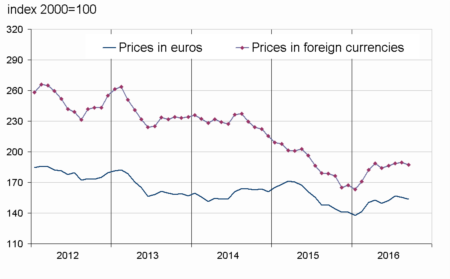
The prices in euros of industrial raw materials fell again in September (−1.3% after −0.9%). Minerals prices continued to decline (−1.3% after −0.9%). The price of iron ore fell back (−6.3% after +5.5%). Precious metals prices declined again (−0.8% after −3.7%). In contrast, the prices of non-ferrous metals were unchanged, after −2.1% in August. The prices of agricultural raw materials also slid (−1.2% after −1.0%), particulary sawn softwood (−3.8% after −0.5%).
graphiqueG_indus_ang – Industrial raw materials
- Source : INSEE
graphiqueG_ensemble_ang – Imported raw materials (excluding energy)
- Source : INSEE
tableautabmatprem – Imported raw materials (excluding energy) in euros
| Index | Changes (%) | |||
|---|---|---|---|---|
| of last month | over the last month | over the last 3 months | over the last 12 months | |
| Food total | 210.3 | –1.0 | –6.7 | –0.3 |
| Tropical foodstuffs | 210.2 | –0.3 | –0.7 | –2.4 |
| Oil seeds, vegetable oils | 234.8 | –0.1 | –10.5 | –1.0 |
| Cereals | 143.4 | –3.8 | –13.4 | –2.0 |
| Sugar | 213.3 | 6.6 | 10.6 | 88.7 |
| Beef meat | 134.3 | –6.3 | –8.6 | –12.9 |
| Industrial raw materials | 153.4 | –1.3 | 0.7 | 3.4 |
| Agricultural raw materials | 114.1 | –1.2 | 0.5 | 7.7 |
| Natural Fibres | 132.9 | –2.7 | 5.2 | 13.2 |
| Natural rubber | 139.2 | 2.3 | 5.9 | 13.5 |
| Hides | 75.5 | 0.1 | 1.6 | –2.7 |
| Wood pulp | 98.0 | –0.3 | 0.9 | –3.5 |
| Tropical wood | 97.8 | 0.2 | –7.3 | –14.3 |
| Sawn softwood | 100.8 | –3.8 | –1.7 | 27.5 |
| Minerals | 175.0 | –1.3 | 0.8 | 2.3 |
| Iron ore | 374.3 | –6.3 | 10.5 | 0.5 |
| Non-ferrous metals | 143.3 | 0.0 | –2.0 | –0.1 |
| Precious metals | 258.1 | –0.8 | 7.0 | 18.8 |
| All commodities | 168.0 | –1.2 | –2.4 | 1.6 |
- Source : INSEE
Pour en savoir plus
Time series : Raw materials prices
