


 12 October 2016
2016- n° 270In July 2016, producer costs for construction were stable Costs of production indices in construction - July 2016
12 October 2016
2016- n° 270In July 2016, producer costs for construction were stable Costs of production indices in construction - July 2016
In July 2016, producer costs in construction were stable following two monthly increases (including +0.5% in June). In particular, costs remained unchanged in specialised construction works and they were virtually stable in the construction of buildings sector (+0.1%). However, costs slightly rose in civil engineering (+0.3%).
In July 2016, producer costs in construction were stable following two monthly increases (including +0.5% in June). In particular, costs remained unchanged in specialised construction works and they were virtually stable in the construction of buildings sector (+0.1%). However, costs slightly rose in civil engineering (+0.3%).
Over a year, producer costs remained practically unchanged in construction (−0.1 % after 0.0% in June). They were virtually stable in building construction (+0.1% after +0.2%). They slowed slightly in specialised construction works (+0.4% after +0.5%) and they continued to decrease in civil engineering (−2.0% after −2.6%).
tableautablo1 – Variations in producer cost indices for construction
| NAF | Heading | Weights (in %) | July 16/ June 16 | July 16 / July 15 |
|---|---|---|---|---|
| F | Construction | 100.0 | 0.0 | -0.1 |
| 41.2 | Construction of buildings | 10.1 | +0.1 | +0.1 |
| 42 | Civil engineering | 16.2 | +0.3 | -2.0 |
| 43 | Specialised construction works | 73.7 | 0.0 | +0.4 |
| 43BT | Buildings | 64.2 | 0.0 | +0.7 |
| 43BTC | New buildings | 24.6 | +0.1 | +0.2 |
| 43BTR | Existing buildings | 39.6 | 0.0 | +0.9 |
| 43TP | Specialised works for civil engineering | 9.5 | +0.1 | -1.3 |
| BT | Buildings (41.2 + 43BT) | 74.3 | 0.0 | +0.7 |
| TP | Public works (42 + 43TP) | 25.7 | +0.2 | -1.7 |
- Source: INSEE
tableautablo2 – Items of producer cost indices for construction
| Costs | items | Q2 16 / Q1 16 | July 16/ June 16 | July 16 / July 15 | |
|---|---|---|---|---|---|
| Equipment | Buildings | -0.2 | -0.9 | +1.6 | |
| Public works | 0.0 | -0.1 | +0.2 | ||
| Labour | Labour costs in construction | -0.5 | /// | /// | |
| Energy | Buildings | +7.5 | -2.4 | -4.4 | |
| Public works | +6.0 | -2.7 | -7.9 | ||
| Materials | Construction of buildings | +0.4 | +0.1 | -2.2 | |
| Existing buildings | +0.1 | -0.2 | -1.3 | ||
| Civil engineering | +2.0 | +1.3 | -6.6 | ||
| Specialised works for civil engineering | -0.1 | -0.1 | -1.4 | ||
| Services | Construction | +0.3 | +1.1 | 0.0 | |
| Transport | Buildings | +1.5 | -0.4 | -0.5 | |
| Public works | +0.4 | 0.0 | -0.2 | ||
- ///: non published estimation
- Source: INSEE
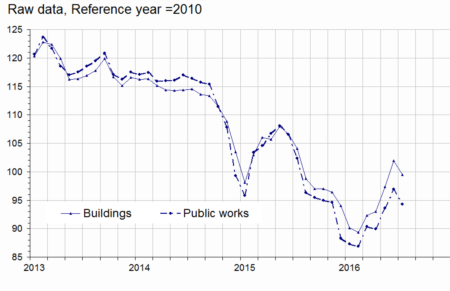
graphiqueGRCoutUK – Production costs in construction
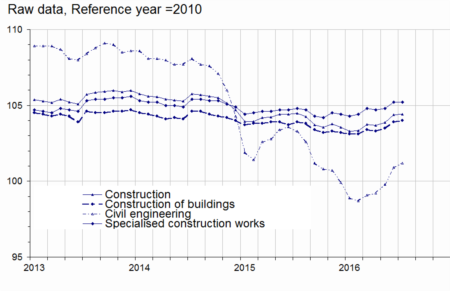
- Source: INSEE
Material costs slowed down
In July 2016, material costs were virtually stable in building construction (+0.1% after +0.9 % in June). Over a year, however, they fell by 2.2%. In civil engineering, they slowed down (+1.3% after +2.9%) due to decelerating bitumen prices. Year-on-year, however, they kept declining sharply (−6.6%).
In specialised works for civil engineering, the costs of materials were virtually stable (−0.1% after +0.3%) but, year-on-year, they decreased further (−1.4%).
graphiqueGRMUK – Materials costs
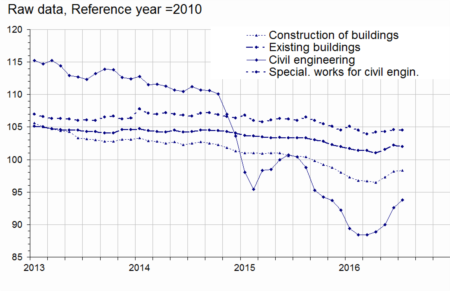
- Source: INSEE
Equipment costs decreased in building construction
In July 2016, equipment costs decreased again in building construction (−0.9%) after rebunding in June (+1.2%). They were virtually stable in public works (−0.1% like in the previous month).
graphiqueGRKUK – Equipment cost
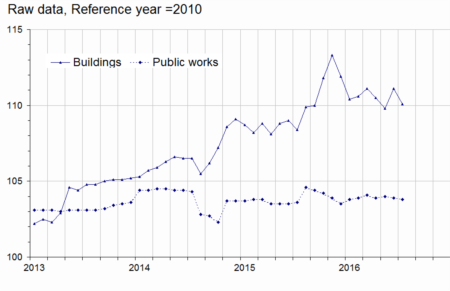
- Source: INSEE
graphiqueGRtravailUK – Labour cost in construction
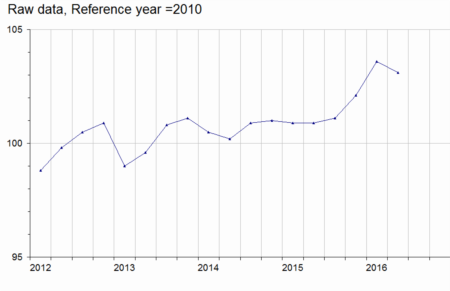
- Source: INSEE
Downturn in energy costs
In July 2016, the costs of energy fell back in building construction (−2.4% after +4.7%) and in public works (−2.7% after +3.5%), because of the decrease in the prices of petroleum products and electricity.
Over a year, the costs of energy retreated again in building construction (−4.4%) and in public works (−7.9%).
graphiqueGRenergieUK – Energy cost
- Source: INSEE
tableaurevision – Variations' revisions
| Apr. 16 | May 16 | June 16 | ||
|---|---|---|---|---|
| F | Construction | /// | +0.1 | /// |
| 41.2 | Construction of buildings | /// | /// | +0.1 |
| 42 | Civil engineering | /// | /// | +0.1 |
| 43 | Specialised construction works | /// | +0.1 | -0.1 |
- ///: unchanged
- How to read it: producer cost variation for building construction in June 2016 published in September 2016 has been updated from +0.3% to +0.4%, that is to say an upward revision by 0.1 points.
- Source: INSEE
Pour en savoir plus
Time series : Producer cost indices for construction
