


 12 October 2016
2016- n° 264Further rise in business start-ups in September 2016 Enterprise births - September 2016
12 October 2016
2016- n° 264Further rise in business start-ups in September 2016 Enterprise births - September 2016
In September 2016, the number of business births for all entreprises speeded up (+2.9% following +1.6% in August), seasonally and working-day adjusted. Start-ups excluding self-managed micro-entrepreneurs went up a little more (+3.0%) than micro-entrepreneurs' registrations (+2.8%).
In September 2016, the number of business births for all entreprises speeded up (+2.9% following +1.6% in August), seasonally and working-day adjusted. Start-ups excluding self-managed micro-entrepreneurs went up a little more (+3.0%) than micro-entrepreneurs' registrations (+2.8%).
graphiqueGraph1EN – Business start-ups (sa-wda *)
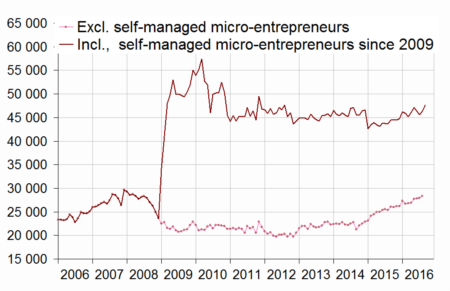
- * Seasonally and working-day adjusted data
- Source: INSEE (Sirene)
tableautab1EN – Business set-ups by month (sa-wda *)
| June 2016 | July 2016 | Aug. 2016 | Sept. 2016 | |
|---|---|---|---|---|
| Excl. self-managed micro-entrepreneurs | 27,862 | 27,955 | 28,314 | 29,166 |
| Variation [m-o-m] % | 0.3 | 0.3 | 1.3 | 3.0 |
| Incl. self-managed micro-entrepreneurs | 46,264 | 45,617 | 46,328 | 47,676 |
| Variation [m-o-m] % | -1.8 | -1.4 | 1.6 | 2.9 |
- * Seasonally and working-day adjusted data
- Source: INSEE (Sirene)
+4.2% year-on-year (quarterly basis)
The raw amount of births added up in the third quarter grew sharply compared to the same period one year before (+4.2%). This surge was the result of sole proprietorship start-ups excluding self-managed micro-entrepreneurs (+12.8%) and company births (+5.7%). Only micro-entrepreneurs' registrations went down during this period (−2.1%). Transportation and business support activities were the sectors that once again contributed the most to the overall rise1.
tableautab2EN – Business start-ups by type
| Moving total % change * | Moving total | Moving total | ||
|---|---|---|---|---|
| over 3 months | over 12 months | January- September 2016 | January- September 2015 | |
| Total | 4.2 | 4.1 | 418,890 | 392,046 |
| Companies | 5.7 | 10.2 | 141,242 | 126,495 |
| Sole proprietorships (SP) | 3.4 | 1.2 | 277,648 | 265,551 |
| SP excluding self- managed micro- entrepreneurs | 12.8 | 16.6 | 109,391 | 97,429 |
| Self-managed micro-entrepreneurs | -2.1 | -6.6 | 168,257 | 168,122 |
- * Total of business start-ups during the last 3 or 12 months compared with the same months a year earlier
- Source: INSEE (Sirene)
+4.1% year-on-year (twelve months basis)
The raw number of business start-ups totted up during the last twelve months kept speeding up (+4.1% year-on-year following +3.5% in August and +2.5% in July). This was due to the sharp rise in births of sole proprietorship excluding self-managed micro-entrepreneurs (+16.6%) and of companies (+10.2%). On the other hand, self-managed micro-entrepreneurs' set-ups decreased once more (−6.6%) but this decline eased (−8.4% in August).
Two business set-ups out of five are self-managed micro-entrepreneurs' registrations
In September 2016, micro–entrepreneurs' registrations amounted to 40.5% of the businesses set up over the twelve last months. One year before, the share was 45.2%.
tableautab0EN – Business set-ups distribution by type
| July 2016 | Aug. 2016 | Sept. 2016 | |
|---|---|---|---|
| Companies | 33.8 | 33.8 | 33.8 |
| Sole proprietorships excluding self-managed micro-entrepreneurs | 25.3 | 25.4 | 25.7 |
| Self-managed micro-entrepreneurs | 40.9 | 40.8 | 40.5 |
- Source: INSEE (Sirene)

1 The contribution of a sector to the overall variation is the observed variation of this sector, weighted by the share of this sector in the total number of births.
Business set-ups by economic activity
graphiqueGraph2EN – Trade and business support activities start-ups (sa-wda *)

- * Seasonally and working-day adjusted data
- Source : Insee, Sirene
graphiqueGraph3EN – Construction and real estate business set-ups (sa-wda *)

- * Seasonally and working-day adjusted data
- Source : Insee, Sirene
tableautab3EN – Number of business set-ups (incl. self-managed micro-enterprises)
| NA | July 2016 | Aug. 2016 | Sept. 2016 | |
|---|---|---|---|---|
| Total | 45,617 | 46,328 | 47,676 | |
| Industry | BE | 1,991 | 1,981 | 2,085 |
| Of which Manufacturing | C | 1,756 | 1,789 | 1,829 |
| Construction | FZ | 5,143 | 5,129 | 5,066 |
| -Wholesale and retail trade, Transport, Accommodation and Food and beverage activities | GI | 13,244 | 13,364 | 14,354 |
| Trade | G | 7,834 | 8,058 | 8,513 |
| Transportation and storage | H | 2,867 | 2,803 | 3,071 |
| Accommodation and food service activities | I | 2,471 | 2,608 | 2,629 |
| Information and communication | JZ | 2,260 | 2,395 | 2,336 |
| Financial and insurance activities | KZ | 1,283 | 1,273 | 1,322 |
| Real estate activities | LZ | 1,585 | 1,614 | 1,643 |
| Business support activities | MN | 10,368 | 10,622 | 10,849 |
| Public administration and defence, education, human health and social work activities | OQ | 5,607 | 5,815 | 5,810 |
| Other services activities | RS | 4,136 | 4,134 | 4,212 |
- * Seasonally and working-day adjusted data
- Source: INSEE (Sirene)
tableautab3bisEN – Fluctuation in the number of business set-ups (incl. self-managed micro-entrepreneurs)
| NA | Sept. 16 / August 16 | Moving total % change** | ||
|---|---|---|---|---|
| sa-wda * | over 3 months | over 12 months | ||
| Total | 2.9 | 4.2 | 4.1 | |
| Industry | BE | 5.3 | -0.3 | -2.9 |
| Of which Manufacturing | C | 2.2 | 0.5 | -3.1 |
| Construction | FZ | -1.2 | -5.6 | -6.0 |
| Wholesale and retail trade, Transport, Accommodation and Food and beverage activities | GI | 7.4 | 8.3 | 8.2 |
| Trade | G | 5.7 | -2.1 | -2.1 |
| Transportation and storage | H | 9.6 | 55.7 | 66.8 |
| Accommodation and food service activities | I | 0.8 | 5.9 | 5.3 |
| Information and communication | JZ | -2.5 | 7.6 | 5.1 |
| Financial and insurance activities | KZ | 3.8 | -2.9 | 2.5 |
| Real estate activities | LZ | 1.8 | 8.6 | 14.3 |
| Business support activities | MN | 2.1 | 8.0 | 8.0 |
| Public administration and defence, education, human health and social work activities | OQ | -0.1 | 2.2 | 3.1 |
| Other services activities | RS | 1.9 | -0.1 | -2.6 |
- * Seasonally and working-day adjusted data
- ** Total of business start-ups during the last 3 or 12 months compared with the same months a year earlier
- Source: INSEE (Sirene)
Pour en savoir plus
Time series : Business demography
