


 21 October 2010
2010- n° 259A moderate improvement of the economic climate in services in October 2010 Monthly survey of services - October 2009
21 October 2010
2010- n° 259A moderate improvement of the economic climate in services in October 2010 Monthly survey of services - October 2009
According to business leaders surveyed in October, the economic situation in services has slightly improved. The synthetic indicator now gets to 101 and goes beyond its long term average for the first time since June 2008.
According to business leaders surveyed in October, the economic situation in services has slightly improved. The synthetic indicator now gets to 101 and goes beyond its long term average for the first time since June 2008.
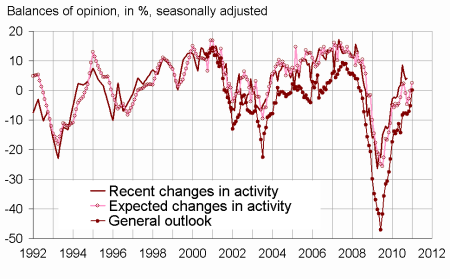
The general outlook also clearly improved, and is now eight points beyond its July level.
The business leaders surveyed consider that their activity kept rising during the last few months, despite the drop in their past operating balance result. They are confident in the following months. According to them, demand should be a bit more sustained in the next few months, and activity and operating balance result should follow their rising trend.
graphiqueGraph1 – Business climate synthetic indicator

graphiqueGraph2 – Activity
tableauTable_quarter – Economic outlook in the services sector
| Average* | June 10 | July 10 | Sept. 10 | Oct. 10 | |
|---|---|---|---|---|---|
| Business climate synthetic indicator | 100 | 98 | 98 | 99 | 101 |
| General outlook | –5 | –8 | –8 | –5 | 0 |
| Past activity | 4 | 2 | 9 | 4 | 4 |
| Expected activity | 4 | –1 | –5 | 0 | 3 |
| Expected demand | 1 | –1 | –3 | –2 | 4 |
| Business situation | 0 | 1 | 1 | –2 | 1 |
| Past selling prices | –2 | –8 | –6 | –8 | –6 |
| Expected selling prices | –1 | –5 | –10 | –5 | –3 |
| Past employment | 3 | 5 | 5 | 7 | 7 |
| except temporary work agencies | 1 | 0 | 0 | –3 | 0 |
| Expected employment | 3 | 0 | –3 | 6 | 6 |
| except temporary work agencies | 0 | –3 | –7 | –3 | –1 |
| Investments | |||||
| Past investments | 2 | –1 | 4 | 3 | 0 |
| Expected investments | 1 | 5 | –2 | –3 | 4 |
| Operating balance result | |||||
| Past result | –1 | 5 | –5 | ||
| Expected result | 0 | –6 | –1 | ||
| Cash position | –10 | –11 | –10 | ||
| Difficulties of supply and demand | |||||
| difficulties of supply and demand | 9 | 11 | 9 | ||
| difficulties of supply only | 23 | 22 | 22 | ||
| difficulties of demand only | 29 | 35 | 32 | ||
| Difficulties in recruitment | 32 | 20 | 21 |
- * Average of the balances of opinion since 1988
- Source: Insee
Documentation
Methodology (2016) (pdf,158 Ko)
Pour en savoir plus
Time series : Economic outlook surveys – Services
