


 30 September 2016
2016- n° 258In July 2016, the sales volume decreased in overall retail trade and in accomodation
and food services but increased again in household services Sales volume in the retail trade and personal services - July 2016
30 September 2016
2016- n° 258In July 2016, the sales volume decreased in overall retail trade and in accomodation
and food services but increased again in household services Sales volume in the retail trade and personal services - July 2016
In July 2016, the sales volume went on declining in trade and repair of motor vehicles and motorcycles (-2.6% after -0.6%) and in retail trade, except of motor vehicles and motorcycles (-0.3% after -0.2%). It edged down in accommodation and food service activities (-0.3% after +0.4% in June). On the contrary, the sales volume increased again in household services (+0.7% after +1.6% in June).

Every index in this issue (except those on large scale food retailing survey) is in volume (tax excluded), seasonally and working day adjusted (SA-WDA). The commentary shows variations of subsections by decreasing contribution. The contribution of a subsection depends on the extent of the change and on its weight.
In July 2016, the sales volume went on declining in trade and repair of motor vehicles and motorcycles (−2.6% after −0.6%) and in retail trade, except of motor vehicles and motorcycles (−0.3% after −0.2%). It edged down in accommodation and food service activities (−0.3% after +0.4% in June). On the contrary, the sales volume increased again in household services (+0.7% after +1.6% in June).
graphiqueGraph1_anglais – Sales volume in the retail trade and personal services
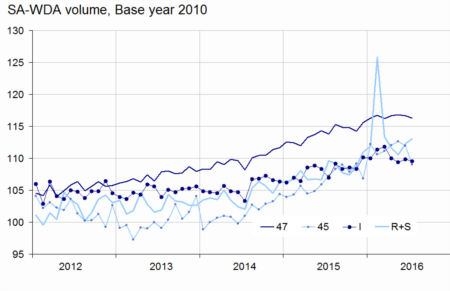
- Source: INSEE
Further slight decrease in retail trade
In July 2016, the sales volume slided slightly again in retail trade, except of motor vehicles and motorcycles (−0.3% after −0.2% in June). According to early estimates, it should be virtually stable in August (−0.1%).
The sales volume decreased again in specialised stores (−0.3%) and retail trade not in stores (−2.5%). It was nearly flat in non-specialised stores (+0.1%). Within specialised retailing, it fell back mainly in retail sale of other household equipment (home appliance, furniture, etc.: −2.2% after +1.5% in June) and in retail
sale of other goods in specialised stores (clothing, pharmacy, etc: −0.5% after +1.3% in June). However, it recovered in retail sale of automotive fuel (+4.4% after −12.7% in June).
The sales volume in retail trade, except of motor vehicles and motorcycles was stable over the last three months and increased sharply year-on-year (+2.3% y-o-y).
tableauTab1_anglais – Variation of sales volume in the retail trade and personal services
| Change in % | |||||
|---|---|---|---|---|---|
| NACE Classification | Weight | July/ June | June/ May | q-o-q (1) | y-o-y (2) |
| 47 Retail trade, except of motor vehicles and motorcycles | 1000 | –0.3 | –0.2 | 0.0 | 2.3 |
| 471 Retail sale in non-specialized stores | 370 | 0.1 | 0.0 | 0.8 | 0.6 |
| 472 to 477 Retail sale in specialized stores | 572 | –0.3 | –0.2 | –0.1 | 3.2 |
| 478 and 479 Retail trade not in stores | 58 | –2.5 | –1.0 | –2.9 | 3.5 |
| 45 Trade and repair of motor vehicles and motorcycles | 1000 | –2.6 | –0.6 | 0.0 | 4.9 |
| I Accommodation and food service activities | 1000 | –0.3 | 0.4 | –1.3 | 1.4 |
| R+S Household services | 1000 | 0.7 | 1.6 | –4.3 | 4.0 |
| R Arts, entertainment and recreation | 422 | 4.4 | 1.3 | –5.9 | 8.8 |
| S Other service activities | 578 | –2.3 | 1.8 | –2.9 | 0.2 |
- (1) Quarter-on-quarter: last three months / previous three months.
- (2) Year-on-year: last three months / same three months of the previous year.
- The codes correspond to different levels of aggregation of the classification NAF rev.2
- Source: INSEE
tableauTabprecoce_anglais – Sales volume in the retail trade: early estimate*
| Change in % | ||
|---|---|---|
| Aug. 2016/ July 2016 | Aug. 2016/ Aug. 2015 | |
| 47 Retail trade, except of motor vehicles and motorcycles | –0.1 | 0.7 |
- * Econometric estimate from a set of sources available within 30 days after the end of the reference month
- Source: INSEE
Sharper drop in trade and repair of motor vehicles and motorcycles
In July, the sales volume in trade and repair of motor vehicles and motorcycles declined more strongly than last month (−2.6% after −0.6%). As in June, the fall affected all of the subsectors, but it was mostly due to the drop in sales of motor vehicles (−3.3%) and sales of motor vehicle parts and accessories (−0.9%).
The sales volume of the whole sector was stable over the last three months and grew substantially year-on-year (+4.9% y-o-y).
tableauTab2_anglais – Sales volume in the retail trade and personal services
| Change in % | |||||
|---|---|---|---|---|---|
| Nace Classification | Weight | July 2016 | July/ June | June/May | q-o-q (1) |
| 47 Retail trade, except of motor vehicles and motorcycles | 1000 | 116.3 | –0.3 | –0.2 | 0.0 |
| 471 Non-specialised stores | 370 | 110.3 | 0.1 | 0.0 | 0.8 |
| 472 to 477 Specialised stores | 572 | 120.1 | –0.3 | –0.2 | –0.1 |
| 472 Retail sale of food, beverages and tobacco in specialised stores | 48 | 130.0 | –0.7 | 0.9 | 0.0 |
| 473 Retail sale of automotive fuel | 77 | 93.5 | 4.4 | –12.7 | –2.6 |
| 474 Retail sale of information and communication equipment | 28 | 178.7 | –0.1 | 1.4 | 0.2 |
| 475 Retail sale of other household equipment | 113 | 104.1 | –2.2 | 1.5 | –1.4 |
| 476 Retail sale of cultural and recreation goods | 48 | 106.7 | –0.8 | 3.2 | 0.2 |
| 477 Retail sale of other goods in specialised stores | 259 | 129.3 | –0.5 | 1.3 | 0.8 |
| 478 et 479 Retail trade not in stores | 58 | 116.3 | –2.5 | –1.0 | –2.9 |
| 45 Wholesale and retail trade and repair of motor vehicles and motorcycles | 1000 | 109.0 | –2.6 | –0.6 | 0.0 |
| 451 Sale of motor vehicles | 671 | 104.8 | –3.3 | –0.5 | –0.2 |
| 452 Maintenance and repair of motor vehicles | 78 | 100.9 | –2.4 | –0.9 | –0.8 |
| 453 Sale of motor vehicle parts and accessories | 227 | 126.6 | –0.9 | –0.8 | 0.8 |
| 454 Sale, maintenance and repair of motorcycles and related parts and accessories | 24 | 86.7 | –1.8 | –1.2 | –3.8 |
| I Accommodation and food service activities | 1000 | 109.5 | –0.3 | 0.4 | –1.3 |
| 55 Accommodation | 239 | 104.0 | 0.4 | –0.9 | –0.9 |
| 56 Food and beverage service activities | 761 | 111.3 | –0.5 | 0.8 | –1.4 |
| 561 Restaurants… | 560 | 111.0 | –0.5 | 0.9 | –1.8 |
| 562 Event catering… | 119 | 105.5 | –0.9 | –1.1 | –1.2 |
| 563 Beverage serving activities | 82 | 121.4 | 0.3 | 2.8 | 0.5 |
| R+S Household services | 1000 | 113.1 | 0.7 | 1.6 | –4.3 |
| R Arts, entertainment and recreation | 422 | 126.3 | 4.4 | 1.3 | –5.9 |
| 90 Creative, arts and entertainment activities | 116 | 106.7 | –1.4 | –2.8 | 0.3 |
| 91 Libraries, archives, museums… | 10 | 127.2 | 2.4 | –1.8 | –2.6 |
| 92 Gambling and betting activities | 106 | 117.5 | –3.8 | 5.4 | 3.3 |
| 93 Sports activities and amusement... | 190 | 143.1 | 11.8 | 1.6 | –12.6 |
| S Other service activities | 578 | 103.4 | –2.3 | 1.8 | –2.9 |
| 95 Repair of computers… | 206 | 87.8 | –3.6 | 0.5 | –3.5 |
| 96 Other personal service activities | 372 | 112.0 | –1.8 | 2.4 | –2.6 |
- (1) Quarter-on-quarter: last three months / previous three months.
- Source: INSEE
Slight retreat in accommodation and food service activities
The sales volume in accommodation and food service activities fell back slightly, returning almost to the level of May (−0.3% after +0.4% in June). It went down in food and beverage service activities (−0.5% after +0.8% in June), mostly in restaurants and fast food activities (−0.5% after +0.9%). On the contrary, it recovered in accommodation (+0.4% after −0.9% in June).
Despite a marked decline over the last three months (−1.3%), the sales volume of the whole sector increased year-on-year (+1.4% y-o-y).
Another rise in household services
In July, the sales volume in household services improved again albeit more moderately (+0.7% after +1.6% in June). This increase was due above all to sports activities and amusement and recreation activities which soared (+11.8%). On the other hand, it fell back in other service activities (−2.3% after +1.8% in June): repair of computers (−3.6%) and other personal service activities, (hairdressing, beauty, etc.: −1.8%).
The sales volume in household services declined strongly over the last three months (−4.3% q-o-q) compared with the previous three months that were buoyed by the ticket sales for the Euro 2016 football championship, but it increased year-on-year (+4.0% y-o-y).
Revisions
The variation in the sales volume for June 2016 has been raised by 0.1 points in accommodation and food services activities while it has been lowered by 0.1 points in trade and repair of motor vehicles. It is unchanged in retail trade. except of motor vehicles and in household services.
In August 2016, turnover fell back in large-scale food retailing
In August, the turnover in large-scale food retailing dipped (−0.5% after +0.8% in July). Sales of non-food products declined again (–0.4% after −0.6% in July), those of automotive fuel fell back (−0.7% after +2.2%) and sales of food products were virtually stable (−0.1%).
tableauTab3_anglais – Monthly turnover indices in large-scale food retailing
| Change in % | ||||
|---|---|---|---|---|
| Aug. 16/ July 16 | July/ June | q-o-q (1) | y-o-y (1) | |
| Turnover | –0.5 | 0.8 | –0.5 | –1.4 |
| Including | ||||
| Sales of food products | –0.1 | 0.8 | 0.4 | –0.4 |
| Sales of non-food products | –0.4 | –0.6 | –1.9 | –2.7 |
| Sales of automotive fuel | –0.7 | 2.2 | –4.5 | –8.3 |
- (1) Quarter-on-quarter: last three months / previous three months.
- Source: INSEE - Monthly survey on large scale food retailing (Emagsa)
Documentation
Methodology (pdf,121 Ko)
Pour en savoir plus
