


 20 September 2016
2016- n° 242In June 2016, producer costs for construction accelerated (+0.5%) Costs of production indices in construction - June 2016
20 September 2016
2016- n° 242In June 2016, producer costs for construction accelerated (+0.5%) Costs of production indices in construction - June 2016
In June 2016, producer costs in construction accelerated (+0.5% after +0.1% in May). Costs rose for all kinds of works, however more in civil engineering (+1.0%) than in construction of buildings (+0.3%) and in specialised construction works (+0.5%).
In June 2016, producer costs in construction accelerated (+0.5% after +0.1% in May). Costs rose for all kinds of works, however more in civil engineering (+1.0%) than in construction of buildings (+0.3%) and in specialised construction works (+0.5%).
Over a year, producer costs in construction were virtually stable (−0.1 %) after a continuous decline since August 2014 (including −0.6% in May 2016). They accelerated in construction of buildings (+0.1% after −0.4% in May) and they increased in specialised construction works (+0.5% after 0.0%). They remained, though, considerably down in civil engineering (−2.7% after −3.5%).
tableautablo1 – Variations in producer cost indices for construction
| NAF | Heading | Weights (in %) | June 16/ May 16 | June 16 / June 15 |
|---|---|---|---|---|
| F | Construction | 100.0 | +0.5 | -0.1 |
| 41.2 | Construction of buildings | 10.1 | +0.3 | +0.1 |
| 42 | Civil engineering | 16.2 | +1.0 | -2.7 |
| 43 | Specialised construction works | 73.7 | +0.5 | +0.5 |
| 43BT | Buildings | 64.2 | +0.4 | +0.8 |
| 43BTC | New buildings | 24.6 | +0.5 | +0.2 |
| 43BTR | Existing buildings | 39.6 | +0.3 | +1.1 |
| 43TP | Specialised works for civil engineering | 9.5 | +0.7 | -1.6 |
| BT | Buildings (41.2 + 43BT) | 74.3 | +0.4 | +0.8 |
| TP | Public works (42 + 43TP) | 25.7 | +0.9 | -2.3 |
- Source: INSEE
tableautablo2 – Items of producer cost indices for construction
| Costs | items | Q2 16 / Q1 16 | June 16/ May 16 | June 16 / June 15 | |
|---|---|---|---|---|---|
| Equipment | Buildings | -0.3 | +2.5 | +2.5 | |
| Public works | 0.0 | 0.0 | +0.5 | ||
| Labour | Labour costs in construction | -0.5 | /// | /// | |
| Energy | Buildings | +7.5 | +4.7 | -4.4 | |
| Public works | +6.0 | +3.5 | -9.0 | ||
| Materials | Construction of buildings | +0.3 | +0.7 | -2.6 | |
| Existing buildings | +0.1 | +0.7 | -1.1 | ||
| Civil engineering | +2.0 | +2.8 | -8.1 | ||
| Specialised works for civil engineering | -0.2 | +0.2 | -1.6 | ||
| Services | Construction | +0.4 | +0.4 | +0.1 | |
| Transport | Buildings | +1.5 | +1.0 | -0.7 | |
| Public works | +0.4 | 0.0 | -0.5 | ||
- ///: non published estimation
- Source: INSEE
graphiqueGRCoutUK – Production costs in construction
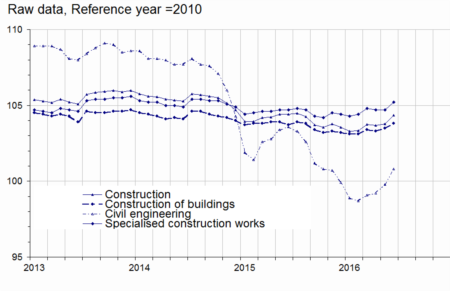
- Source: INSEE
Material costs rose for all kinds of works
In June 2016, material costs rose again in construction of buildings (+0.7% after +0.8 % in May). Over a year, however, they fell down by 2.6%. In civil engineering, they accelerated month-on-month (+2.8% after +1.2%) due to the sharp increase in prices of bitumen. However, they remained much lower than a year before (−8.1%).
In specialised works for civil engineering, the costs of materials increased slightly (+0.2% after +0.1%) due in particular to the ongoing growth in prices of ribbed bars.
graphiqueGRMUK – Materials costs
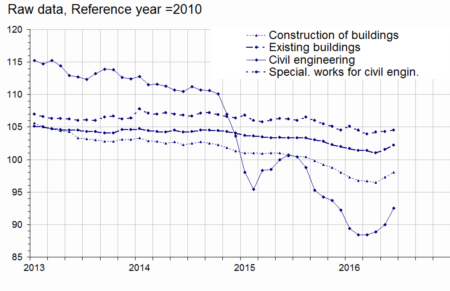
- Source: INSEE
Equipment costs accelerated in building construction
In June 2016, equipment costs recovered in building construction (+2.5% after −1.4%). They were stable in public works (after +0.1% in May).
graphiqueGRKUK – Equipment cost
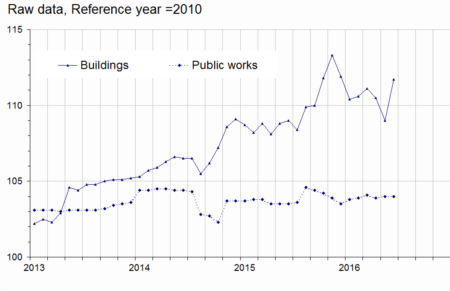
- Source: INSEE
graphiqueGRtravailUK – Labour cost in construction

- Source: INSEE
Energy costs continued to increase
In June 2016, the costs of energy in building construction continued to increase strongly (+4.7% after +4.6% in May), due mostly to a further rise in the prices of road diesel fuel. Similarly, in public works, they rose again (+3.5% after +4.1%), because of the increase in the prices of petroleum products as well as in the prices of electricity.
However, these costs were still lower than a year before in building construction (−4.4% year-on-year) and in public works (−9.0%).
graphiqueGRenergieUK – Energy cost
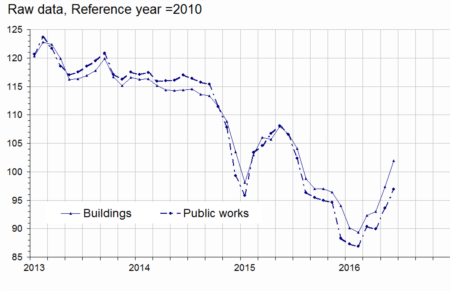
- Source: INSEE
tableaurevision – Measure of variations' revisions
| Mar. 16 | Apr. 16 | May 16 | ||
|---|---|---|---|---|
| F | Construction | /// | -0,1 | -0,3 |
| 41.2 | Construction of buildings | /// | -0,1 | -0,1 |
| 42 | Civil engineering | /// | -0,1 | -0,1 |
| 43 | Specialised construction works | /// | -0,2 | -0,3 |
- ///: unchanged
- How to read it: producer cost variation for construction in May 2016 published in August 2016 has been updated from +0.4% to +0.1%, that is to say a downward revision by 0.3 points.
- Source: INSEE
Pour en savoir plus
Time series : Producer cost indices for construction
