


 31 August 2016
2016- n° 232In July 2016, overall agricultural prices decreased by 0.2% over one year Indices of agricultural prices - Juillet 2016
31 August 2016
2016- n° 232In July 2016, overall agricultural prices decreased by 0.2% over one year Indices of agricultural prices - Juillet 2016
In July 2016, overall producer prices of agricultural products faltered slightly compared to last year: –0.2% over one year, after +0.1% in June. Excluding fruits and vegetables, they went down by 2.0% year-on-year while they slightly rose (+0.3%) month-on-month.

Erratum: this Informations Rapides replaces and supersedes the issue published on 31 August 2016 at 12 am, as the year-on-year variation in the overall index of producer prices of agricultural products has been revised from +0.8% to +0.1% in June 2016.
In July 2016, overall producer prices of agricultural products faltered slightly compared to last year: –0.2% over one year, after +0.1% in June. Excluding fruits and vegetables, they went down by 2.0%year-on-yearwhile they slightly rose (+0.3%)month-on-month.
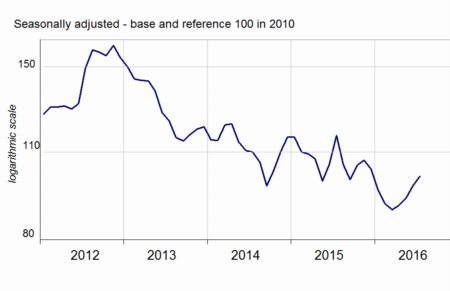
Cereals prices kept on growing, oleaginous prices slipped back
Soft wheat prices strongly rose in July (+8.7%). In France the bad ongoing harvest prompted local market participants to increase the value of thiscommodity, despite an abundant world supply. On the other hand, maïze crop forecasts are somewhat more upbeat. Maïze prices declined (−5.9%), also in relation with good growing conditions in the United States or in the Black Sea region. Oleaginous prices declined (−4.0 %) in July with the prospect of a significant global crop while the drop in the prices of oil and palm oil limited the demand for rape as a substitute for these products.
graphiquecereal – Producer prices of cereals
- Source: INSEE
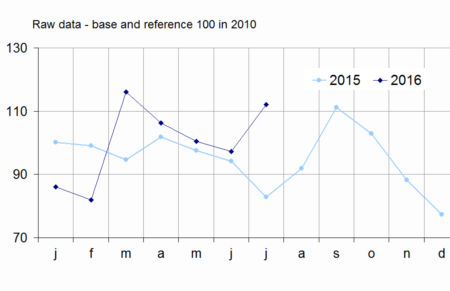
Over one year, leap in the prices of potates, fuits and vegetables
Compared to July 2015, potatoes prices surged (+80.2%). The 2015 crop, still put on sale, reached its long-term average whereas the previous one was exceptional, which had led to a sharp price fall last year.
Over one year, fruits and vegetables prices soared (+21.4%). The heavy rainy spring lessened the yields of open-air seasonal productions (apricots, peaches, nectarines, cherries and melons). Moreover, the good weather in July made the consumers to find appealing these seasonal products. The fair weather also stimulated the demand for tomatoes, vegetable mainly grown in greenhouses, whose price increased too.
graphiquevegetable – Producer prices of fresh vegetables
- Source: SSP (ministry in charge of agriculture)
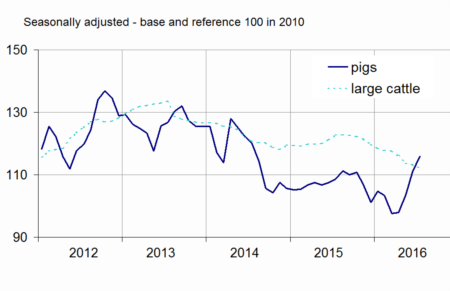
Animal prices rose over the month
In July, animal prices slightly rose (+0.5%), but dipped over one year (−2.1%). Indeed, large cattle prices has been falling steadily for a year (−8.0% compared to July 2015), notably reflecting the milk crisis which prompted French farmers to have more cows slaughtered. In addition, the European livestock has expanded since the end of milk quotas in 2015. Conversely, pig prices have been picking up for one quarter (+18.4%) : the global exportations soared, mainly toward China.
graphiquepig – Producer prices of pigs and large cattle
- Source : INSEE
Cow milk prices dropped over one year (−9.2 %) as a result of the current over-production crisis mainly related to the end of quotas and the Russian embargo.
tableauTab1 – Indices of producer prices of agricultural products (IPPAP)
| Variation as % over | |||||
|---|---|---|---|---|---|
| Weights | July 2016 | a month | 3 months | a year | |
| Agricultural goods output | 1000 | 113.0 | /// | /// | –0.2 |
| excluding fruits and vegetables | 900 | 113.0 | +0.3 | +2.1 | –2.0 |
| Crop output (excluding fruits and vegetables) | 505 | 119.6 | +0.4 | +5.0 | +0.3 |
| Cereals | 188 | 100.7 | +3.4 | +11.1 | –13.7 |
| of which soft wheat | 112 | 98.7 | +8.7 | +15.8 | –11.9 |
| grain maize | 41 | 97.2 | –5.9 | +6.1 | –8.0 |
| Potatoes | 26 | 227.6 | /// | /// | +80.2 |
| Wines | 177 | 134.2 | –0.7 | +0.7 | +4.0 |
| protected designation of origin | 84 | 144.7 | –0.2 | +1.6 | +8.6 |
| other wines | 23 | 143.5 | –3.8 | –1.4 | –3.8 |
| Oleaginous | 49 | 96.1 | –4.0 | –1.2 | –8.1 |
| Horticultural products | 30 | 110.6 | –0.2 | +0.3 | +2.9 |
| Other crop products | 36 | 107.4 | –0.7 | –0 .2 | –0.7 |
| Fruits and vegetables (1) | 100 | 112.9 | /// | /// | +21.4 |
| Fresh vegetables | 53 | 112.1 | /// | /// | +35.4 |
| Fresh fruits | 35 | 114.0 | /// | /// | +11.0 |
| Animal output | 395 | 104.6 | 0.0 | –1.9 | –5.2 |
| Animals | 234 | 111.3 | +0.5 | +1.5 | –2.1 |
| of which large cattle | 96 | 112.2 | –1.0 | –3.3 | –8.0 |
| calves | 26 | 102.3 | –1.4 | –7.1 | +1.3 |
| pigs | 54 | 115.9 | +4.3 | +18.4 | +6.9 |
| sheep | 10 | 113.6 | +3.5 | +1.8 | –0.9 |
| poultry | 46 | 109.0 | –0.5 | –1.3 | –1.0 |
| of which chicken | 28 | 108.8 | –0.5 | –1.2 | –1.1 |
| Milk | 147 | 94.2 | /// | –7.1 | –8.6 |
| of which cow milk (2) | 137 | 93.0 | /// | –7.6 | –9.2 |
| Eggs | 15 | 101.8 | –7.6 | –6.4 | –21.8 |
- * Except for fresh fruits, fresh vegetables and potatoes
- (1) Including vegetables for industry.
- (2)The June value of cow milk price indice is carried forward in July
- Sources: INSEE, SSP (ministry in charge of agriculture)
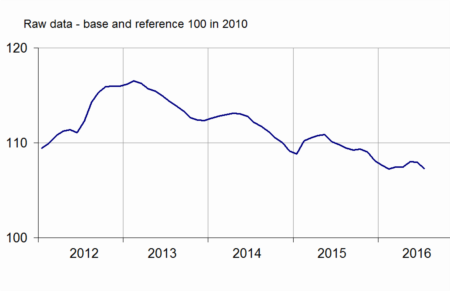
Purchase prices of means of production declined by 0.6% in July and by 2.3% over one year
In July, intermediate consumption prices fell back by 0.7% over one month and by 3.0 % over one year due to the drop in fertilisers and energy prices. Capital goods prices slightly grew over one month (+0.2 %) and over one year (+0.3 %).
graphiquemeans – Purchase prices of the means of agricultural production
- Sources: INSEE, SSP (ministry in charge of agriculture)
tableauTab2 – Indices of purchase prices of the means of agricultural production (IPAMPA)
| Weights | July 2016 | variation as % over | |||
|---|---|---|---|---|---|
| a month | 3 months | a year | |||
| Total input | 1000 | 107.3 | –0.6 | –0.1 | –2.3 |
| Intermediate consumptions | 764 | 107.5 | –0.7 | –0.3 | –3.0 |
| Energy | 100 | 92.8 | –2.7 | +5.2 | –7.3 |
| Seeds | 57 | 104.3 | –1.3 | –2.2 | –3.8 |
| Fertilisers and soil improvers | 92 | 104.7 | –4.3 | –9.4 | –11.1 |
| Plant protection products | 78 | 100.5 | 0.0 | –0.2 | +0.1 |
| Animal feed | 205 | 113.5 | +0.4 | +1.7 | –3.5 |
| Veterinary expenses | 43 | 117.7 | +0.1 | +0.5 | +3.2 |
| Small equipment and tools | 17 | 106.9 | –0.5 | +0.4 | –2.5 |
| Maintenance of materials | 67 | 113.8 | +0.4 | +0.5 | +0.4 |
| Maintenance of buildings | 9 | 107.1 | 0.0 | +0.3 | 0.0 |
| Other goods and services | 97 | 105.4 | 0.0 | 0.0 | +3.5 |
| Goods and services contributing to investment | 236 | 107.2 | +0.2 | +0.6 | +0.3 |
| Material | 186 | 108.4 | +0.3 | +0.6 | +0.8 |
| Tractors | 79 | 108.9 | +0.5 | +1.2 | +1.2 |
| Machinery and equipment for cultivation | 36 | 110.2 | 0.0 | +0.2 | +0.9 |
| Machinery and equipment for harvesting | 42 | 108.4 | +0.1 | +0.2 | +1.1 |
| Utility vehicles | 18 | 104.1 | –0.1 | 0.0 | –0.4 |
| Buildings | 50 | 102.9 | 0.0 | +0.6 | –1.7 |
- (1) The repayment of the domestic tax on energy product (TICPE) benefiting farmers has been applied in advance for the year 2016
- Sources: INSEE, SSP (ministry in charge of agriculture)
Documentation
Methodology (pdf,122 Ko)
Pour en savoir plus
Time series : Indices of agricultural prices
